. 2017 Aug 18;6:e24820. doi: 10.7554/eLife.24820

Figure 3. Live imaging of Fat4-Ds1 accumulation dynamics reveals threshold response to Ds1 levels at the single cell.

(A) Schematic of the two-cell assay. In this assay two cells are restricted to a bowtie-shaped microwell allowing imaging of accumulation dynamics over time. (B) A filmstrip showing a movie in the two-cell assay with HEK-Fat4-citrine cell (green) co-cultured with a HEK-Ds1-mCherry cell (red) (see Video 1). Imaging started after the addition of the 100 ng/ml doxycycline. Each image in the filmstrip is a sum of 8 z-slices encompassing the total width of the cells. As Ds1 levels increases, both proteins co-localize and accumulate at the cell boundary (yellow arrow). Scale bar - 10 μm. (C) Quantitative analysis of accumulation dynamics. The levels of total cellular Fat4-citrine (green solid line), total cellular Ds1-mCherry (red solid line), boundary Ds1-mCherry (red dashed line), and boundary Fat4-citrine (green dashed line) are plotted as a function of post-induction time. The fluorescence of both proteins exhibit a threshold response (black dashed line). (D–E) Mean boundary levels of Fat4-citrine and Ds1-mcherry are proportional to each other. Analysis of the single cell movie (D) and snapshots (E) shows that Fat4 and Ds1 fluorescence at the accumulating boundary are proportional to each other. ρ and n, correspond to the Pearson correlation coefficient and the number of frames, respectively. Supplementary figure 1 (Figure 3—figure supplement 1) shows accumulation dynamics of free co-culture experiments and the non-linear accumulation of all movies shown here. Supplementary figure 2 (Figure 3—figure supplement 2) shows the distribution and dynamics of membrane Ds1 vs. total Ds1 in the cell.

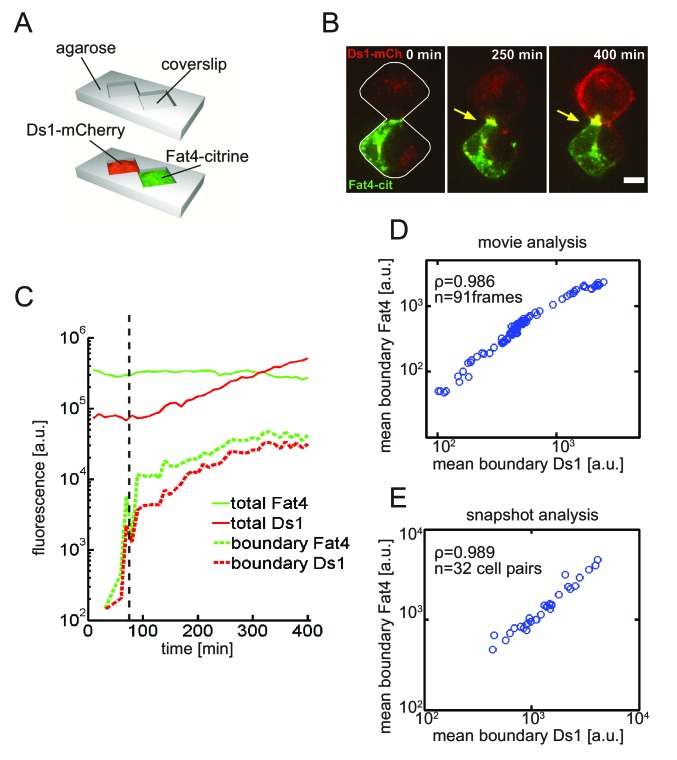
Figure 3.

Figure 3—figure supplement 1. Live imaging of Fat4-Ds1 accumulation dynamics in free co-culture reveals threshold response to Ds1 levels.

Figure 3—figure supplement 1.

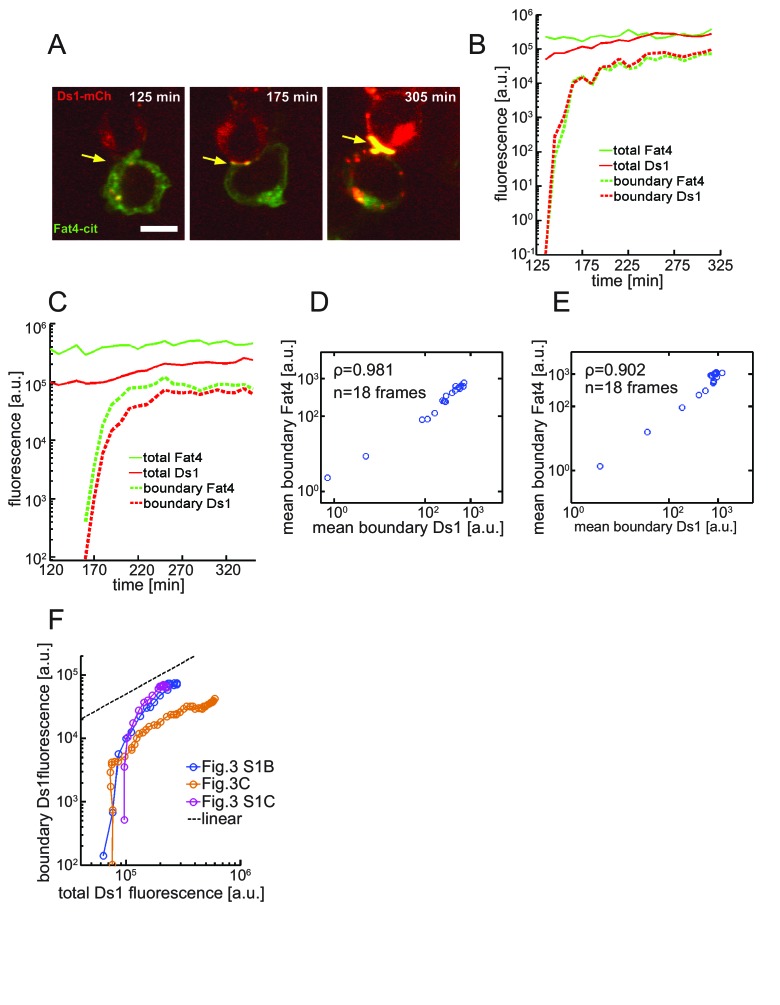
(A) A filmstrip showing a movie from a free co-culture (i.e. not in a two cell assay) with Hek-Fat4-Citrine cell (green) co-cultured with a Hek-Ds1-mCherry cell (red). Imaging started two-hours after the addition of 100 ng/ml doxycycline. Each image in the filmstrip is a sum of 13 z-stacks encompassing the total width of the cells. As Ds1 levels increase, both proteins co-localize and accumulate at the cell boundary (yellow arrow). Scale bar - 10 μm. (B–C) Quantitative analysis of accumulation dynamics in two free co-culture movies. Here (B) is the analysis of the movie shown in (A) and (C) is the analysis of an additional free co-culture movie (not shown). The levels of total cellular Fat4-Citrine (green solid line), total cellular Ds1-mCherry (red solid line), boundary Ds1-mCherry (red dashed line), and boundary Fat4-citrine (green dashed line) are plotted as a function of post-induction time. Scale bar - 10 μm. (D–E) Analysis of the single cell movies in (B–C) shows that Fat4 and Ds1 fluorescence at the accumulating boundary are proportional to each other. (F) A log-log plot of Ds1 levels on the accumulating boundaries as a function of total Ds1 levels in the cell. The three plots correspond to the data shown in Figure 3C (orange), Figure 3—figure supplement 1B (blue), and Figure 3—figure supplement 1C (purple). Slopes higher than 1 (black dashed line) indicate non-linear accumulation of Fat4-Ds1 complexes as a function of Ds1 in the cell.
Figure 3—figure supplement 2. The membrane fraction of Ds1 mCherry is large and proportional to the total Ds1-mCherry in the cell.

Figure 3—figure supplement 2.

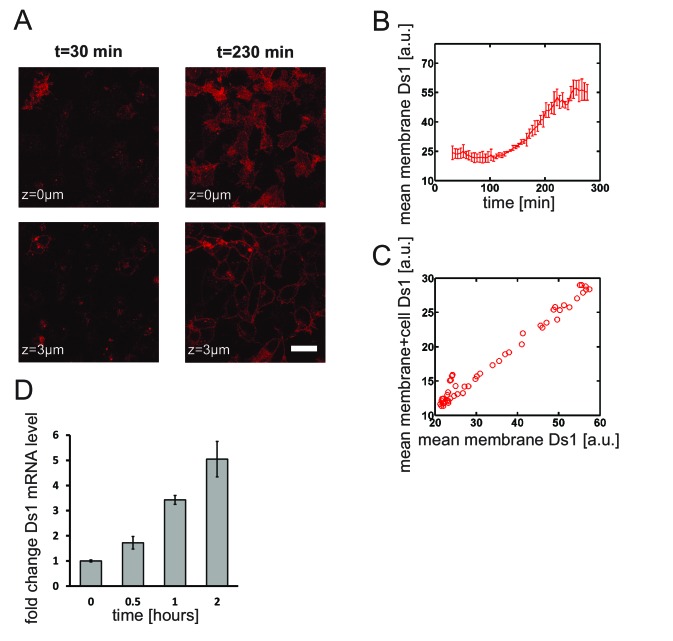
(A) Snapshot from a confocal time-lapse movie tracking dynamics and localization Ds1-mCherry levels in Hek-Ds1-mCherry cells. Ds1-mCherry was imaged at 7 z-planes. 1 μm apart, every 5 min, starting 32 min after doxycycline induction. Ds1-mCherry is localized both to the cell membrane (z = 0 μm plane) and to intracellular vesicles (see intracellular spots inside the cells at z = 3 μm plane). Scale bar - 10 μm. (B) The mean Ds1-mCherry level at the z = 0 μm plane, corresponding to the membrane fluorescence, as a function of time. Fluorescence of Ds1-mCherry levels starts increasing about 100 min after doxycycline induction. The data shown is an average of four movies and the error bar represent the standard error of the mean. This delay is probably due to finite maturation time of Ds1-mCherry. (C) The mean membrane Ds1-mCherry level (measures at z = 0 μm) is proportional to the mean total Ds1 mCherry levels (mean over all z-planes). (D) Fold change in Ds1 mRNA levels measured by qPCR show that the expression increases linearly in the first 2 hr showing that the delay in fluorescence levels observed in (B) is not due to delay in expression. Ds1 mRNA levels in each sample were normalized to GAPDH mRNA. Fold change is measure with respect to the mRNA levels with no doxycycline induction (t = 0). The values shown are the average of three independent repeats and the error bars represent the standard error of the mean.