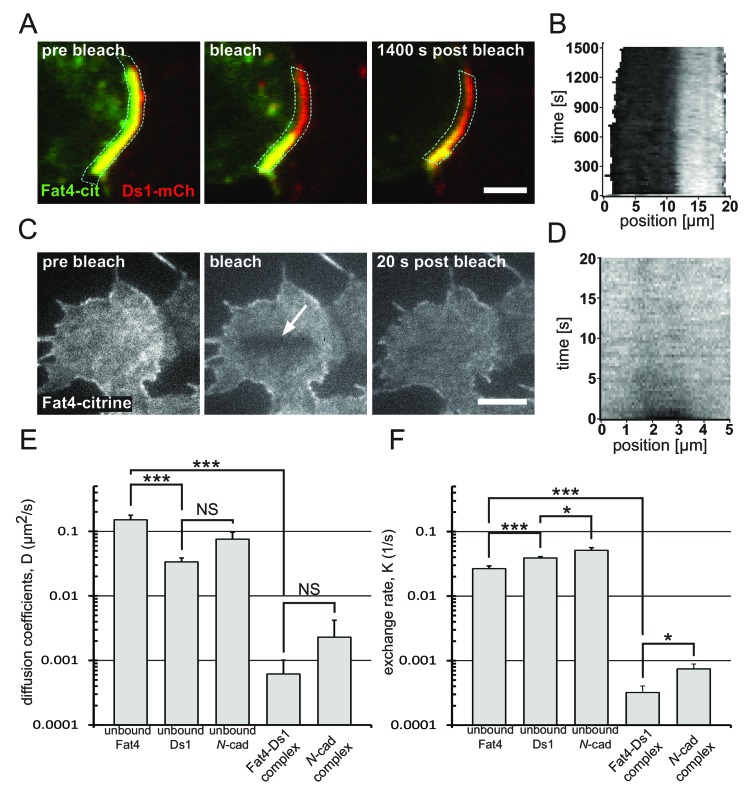
Figure 4. Bound Fat4-Ds1 complexes on the boundary are more stable than unbound Fat4 and Ds1.
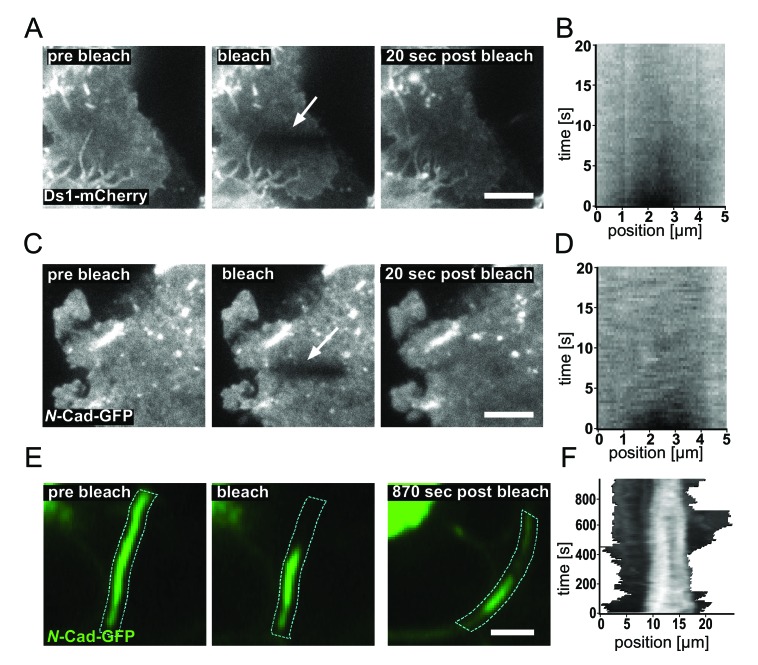
(A) A filmstrip showing a fluorescence recovery after photobleaching (FRAP) experiment on a boundary exhibiting accumulation (yellow) of Fat4-citrine (green) and Ds1-mCherry (red). (see Video 2) (B) A kymograph showing the fluorescence recovery profile along the boundary outlined in blue in (A). The fluorescence level (gray scale) is shown as a function of the position along the boundary (x-axis), and the time after photobleaching (y-axis). (C) A filmstrip from FRAP-TIRF experiment on a cell that express Fat4-citrine (see Video 3). Arrow indicates the bleached area. (D) A kymograph showing the fluorescence recovery profile in the bleached area in (C). Almost full recovery of the bleached area is obtained after 20 s. Scale bars - 5 μm. (E–F) Distributions of Diffusion coefficients (E) and exchange rates (F) obtained from analysis of FRAP experiments as those shown in (A–D). * and *** correspond to p-value<0.05 and p-value<0.001, respectively, as estimated by t-test. The number of experiments for each sample are: unbound Fat4 n = 29, unbound Ds1 n = 36, unbound N-cadherin n = 21, Fat4-Ds1 complex n = 10, N-cadherin complex n = 11. Error bars correspond to SEM. Supplementary figure (Figure 4—figure supplement 1) shows the analysis for unbound Ds1-mcherry, unbound N-cadherin-GFP, and the bound N-cadherin complex.


