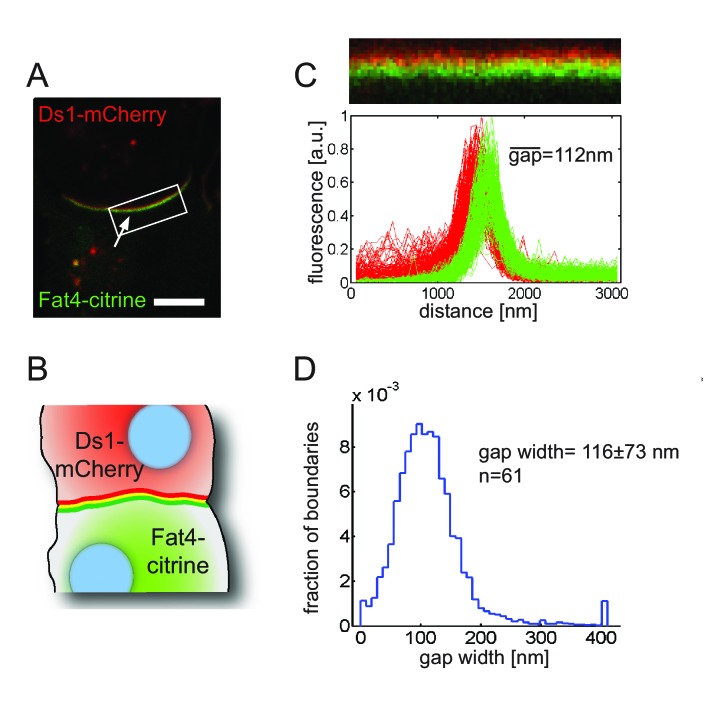
Figure 5. Fat4-citrine and Ds1-mCherry fluorescence at the boundary between cells are shifted by 100–200 nm.
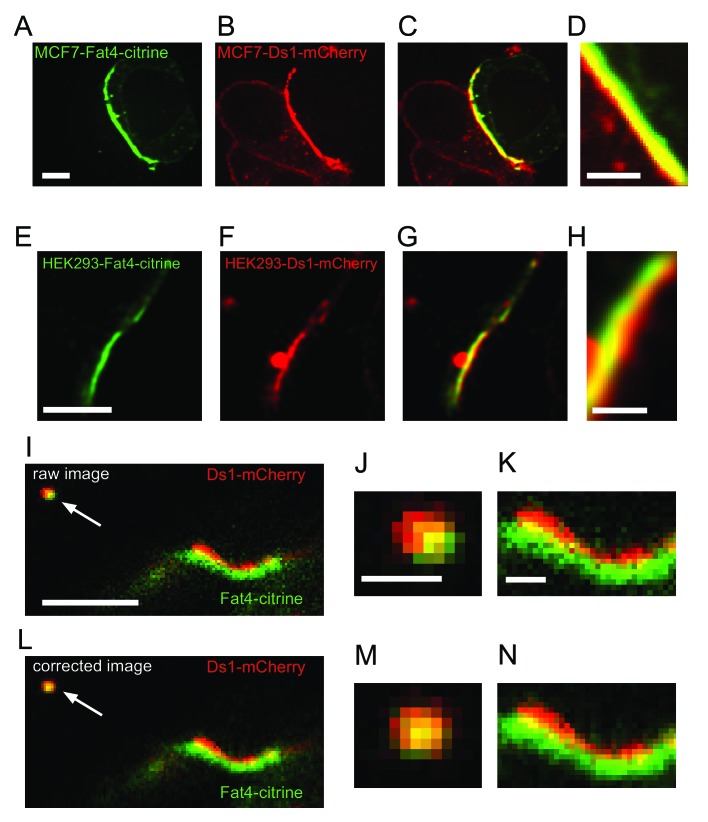
(A) A high resolution image of a boundary exhibiting a ‘rainbow’ feature (composed of three stripes green, yellow and red; white arrow) indicating a shift between red and green fluorescence. Scale bar - 5 μm. (B) An illustration of the observed ‘rainbow’ feature. (C) A straightened version of the boundary shown in A (top). Fluorescence profiles (bottom) of Fat4-citrine (green) and Ds1-mCherry (red) along lines perpendicular to the boundary. Mean gap size for this boundary is as indicated (D) Probability distribution function of the distance between the peaks in the fluorescence profiles. Mean gap width for 61 boundaries as indicated. Supplementary figure (Figure 5—figure supplement 1) shows control experiments in MCF7 cells, super resolution STED images, and rainbows after correction of chromatic aberrations.


