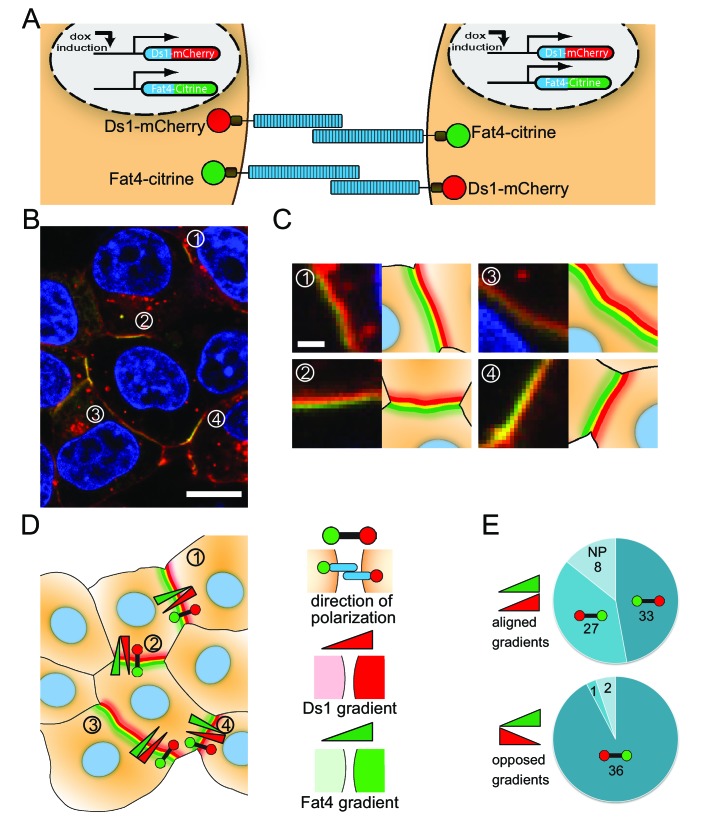
Figure 6. Fat4-citrine and Ds1-mCherry polarize in cells expressing both proteins.
(A) Schematic illustration of the stable cell lines expressing both Fat4-citrine and inducible Ds1-mCherry in the same cell. (B) An image of HEK293 cells expressing both Fat4-citrine and Ds1-mCherry. A rainbow feature (composed of three stripes green, yellow and red) is evident at the boundary between the cells. Scale bar - 10 μm. (C) Zoom in on the boundaries in (B) marked by the numbers 1–4. Each boundary is presented next to its schematic illustration. Scale bar - 1 μm (D) An illustration of all the cells and boundaries shown in (B). The red-green barbells indicate the direction of polarity as determined by analysis of the rainbow. In this notation, the red and green circles marks the 'red side' and the 'green side' of the rainbow, respectively (see schematic of the notation on the right panel). The red and green triangles represent the directions of the cytoplasmic Ds1 and Fat4 gradients between the two cells flanking the boundary, respectively (cytoplasmic levels where measured in the area adjacent to the boundary – see Materials and methods). (E) Pie charts showing how the direction of polarization (red-green barbell) aligns with either the Fat4 expression gradient (green triangle), or the Ds1 expression gradient (red triangle), or both, in the 107 analyzed boundaries. In the boundaries where the Fat4 and Ds1 gradients are opposed (bottom pie chart) the polarity almost always (36 out of 39) aligns in a direction compatible with both gradients. In the boundaries where the Fat4 and Ds1 gradients are aligned (top chart), the polarity cannot be compatible with both gradients. In these cases, it aligns with the Fat4 gradient in about half of the boundaries (27 out of 68), and with the Ds1 gradient in the other half (33 out of 68). NP – Non-polarized boundaries (no clear rainbow observed). Supplementary figure (Figure 6—figure supplement 1) shows that the polarization aligns with the expression gradient that existed prior to boundary accumulation.


