Figure 4.
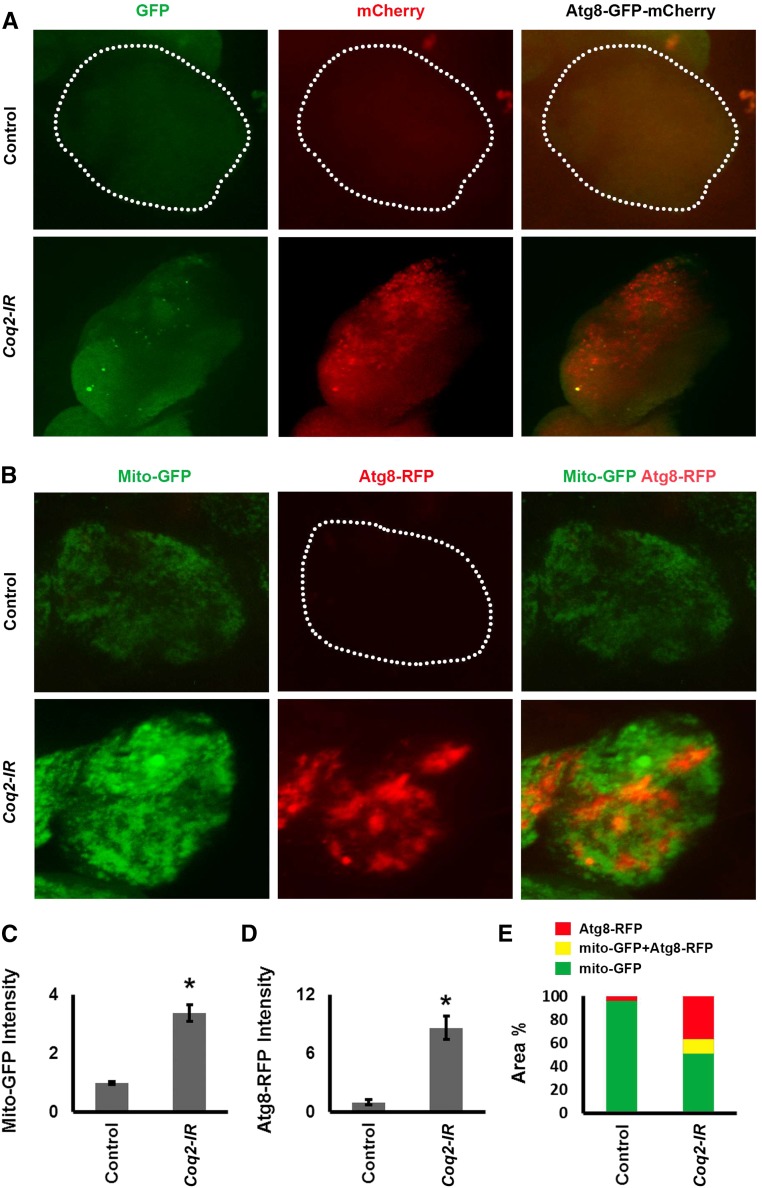
Coq2 gene silencing induced autophagy and mitophagy. (A) Fluorescence micrographs showing nephrocytes of adult female flies 1-day postemergence, expressing a dual-labeled GFP-Atg8-mCherry autophagy marker protein specifically in nephrocytes (UAS-GFP-Atg8-mCherry construct driven by Dot-Gal4). Dotted lines indicate nephrocyte cell boundary. Atg8 is present in autophagosomes and subsequently accumulates in autolysosomes. Fluorescence from the compartmentalized marker protein is punctate in appearance. Both GFP and mCherry fluorescence can be detected in autophagosomes. In the acidic lysosome lumen, GFP fluorescence undergoes rapid quenching whereas mCherry retains fluorescence activity. Therefore only very early autolysosomes will transiently exhibit GFP fluorescence. Because Atg8 accumulates to high levels in autolysosomes, mCherry fluorescence is relatively stronger in this compartment. Upper panels show control nephrocytes (normal Coq2 gene expression) in which autophagy is essentially undetectable. Lower panels show nephrocytes in which Coq2 gene expression was silenced (Coq2-IR) in which a few autophagosomes were present (GFP, green; GFP-Atg8-mCherry, yellow) and autolysosomes were highly abundant (mCherry, red). (B) Fluorescence micrographs showing nephrocytes of adult female flies 1-day postemergence, expressing GFP-labeled mitochondria and Atg8-RFP marker protein in nephrocytes. Dotted line indicates nephrocyte cell boundary. Upper panels show control nephrocytes (normal Coq2 gene expression) with labeled mitochondria (Mito-GFP, green), essentially undetectable autophagy (Atg8-RFP, red), and no overlapping yellow fluorescence in merged images (Mito-GFP Atg8-RFP). Lower panels show nephrocytes in which Coq2 was silenced (Coq2-IR) with increased mitochondrial fluorescence (higher Mito-GFP fluorescence, green), fluorescence because of Atg8 in autophagosomes/autolysosomes (Atg8-RFP, red), and overlap of fluorescence indicating mitophagy (Mito-GFP Atg8-RFP, yellow). (C) Quantitative comparison of Mito-GFP fluorescence in control versus Coq2-IR nephrocytes, expressed relative to control. The increased fluorescence due to Coq2 silencing is shown relative to control. For each group, 30 nephrocytes (six nephrocytes from each of five flies) were examined (*P<0.05). (D) Quantitative comparison of Atg8-RFP fluorescence in control versus Coq2-IR nephrocytes, expressed relative to Control. For each group, 30 nephrocytes (six nephrocytes from each of five flies) were examined (*P<0.05). (E) Quantitative spatial comparison of Mito-GFP (green), Atg8-RFP (red), and Mito-GFP Atg8-RFP (yellow) fluorescence in control versus Coq2-IR nephrocytes.

