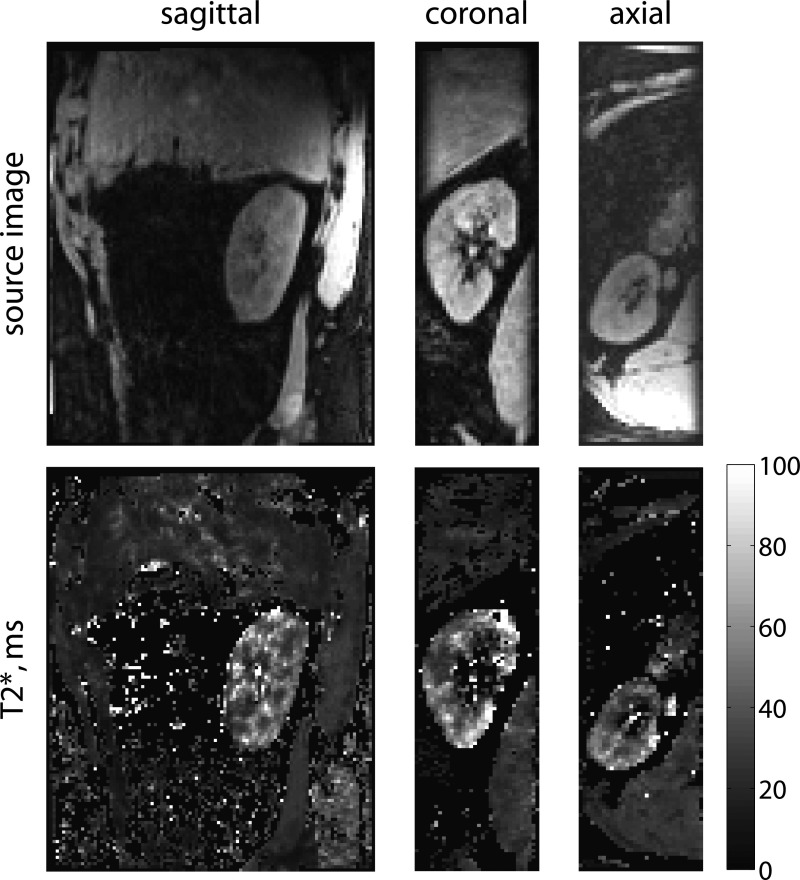
Figure 2.
Renal BOLD T2* map shows higher blood oxygenation levels in the cortex than medulla. T2* maps and source images from a normal volunteer in three planes from a full three-dimensional dataset are shown. The images were acquired with a free-breathing prospectively navigated method,58 with a total scan time of 5 minutes and 13 seconds. T2* is higher in the cortex than the medulla, reflecting higher levels of blood oxygenation in the cortex.

