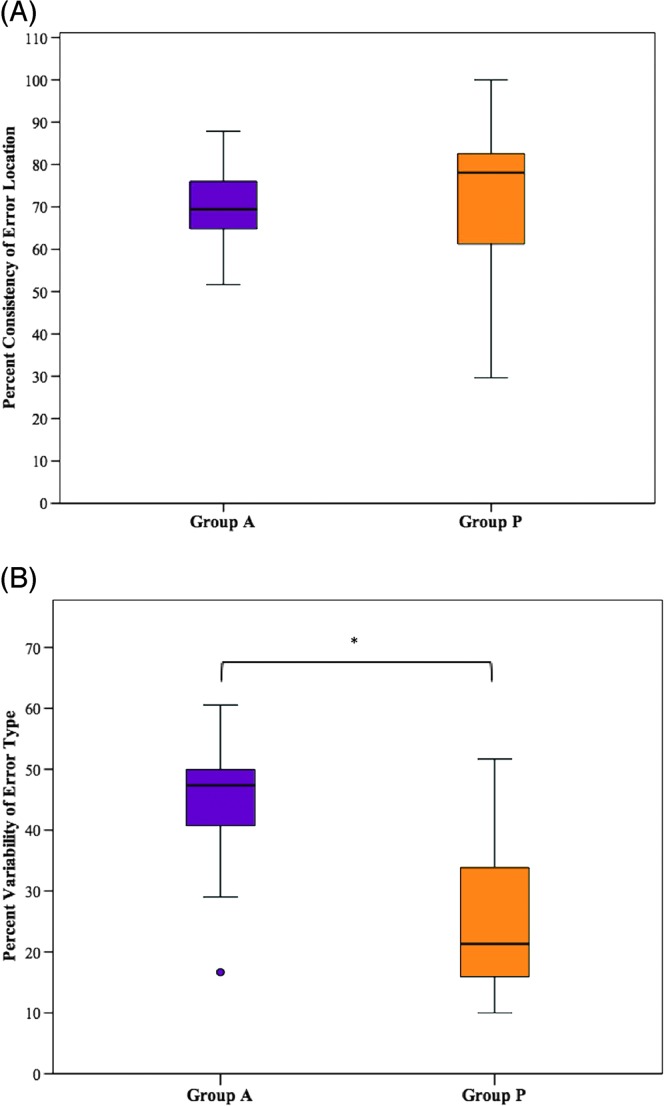
Figure 1.
Group performance on (A) consistency of error location and (B) variability of error type in the blocked presentation condition. The primary (bold middle) horizontal bar denotes the median, and the extreme bars on each end denote the maximum and minimum values. Group A = individuals with acquired apraxia of speech (AOS) and concomitant aphasia; Group P = individuals with aphasia without acquired AOS; ○ = outlier, * = p < .05.

