Figure 3.


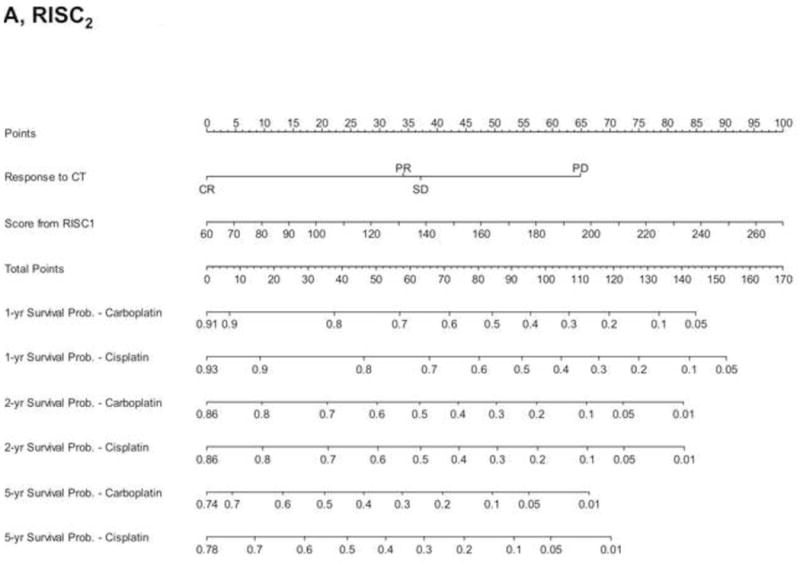
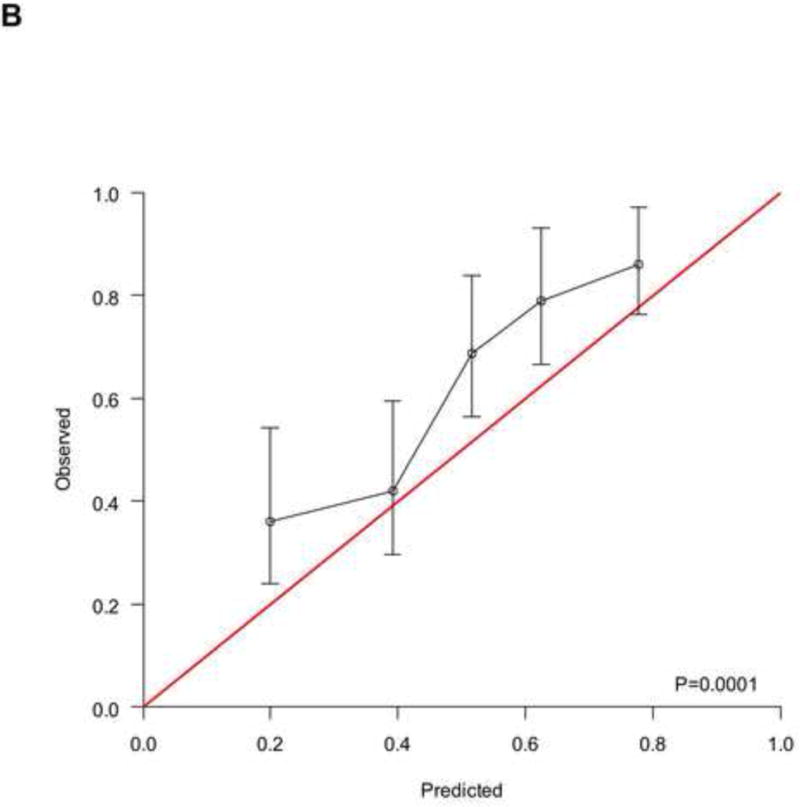
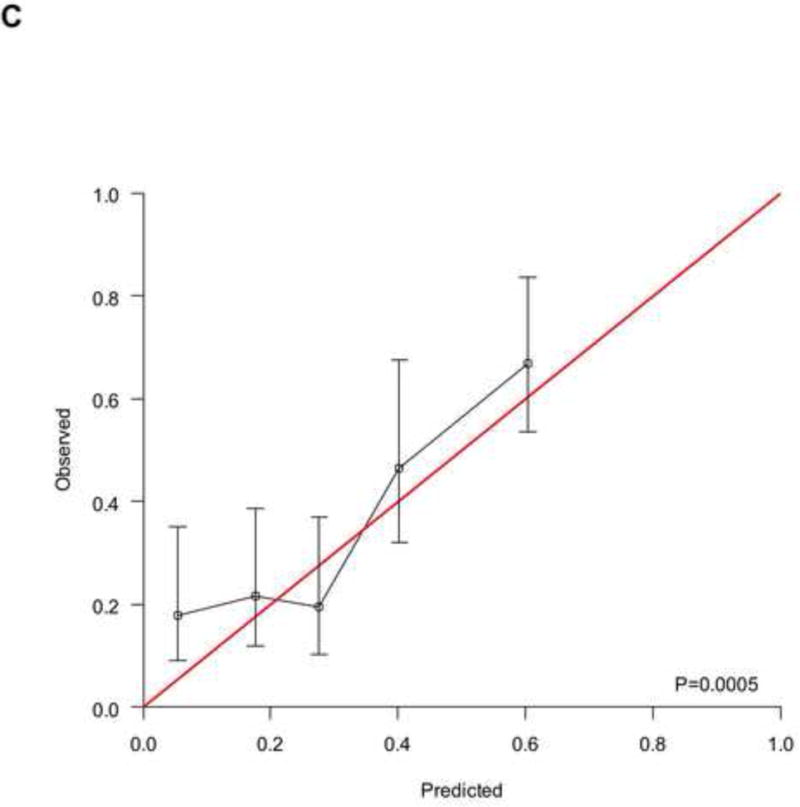
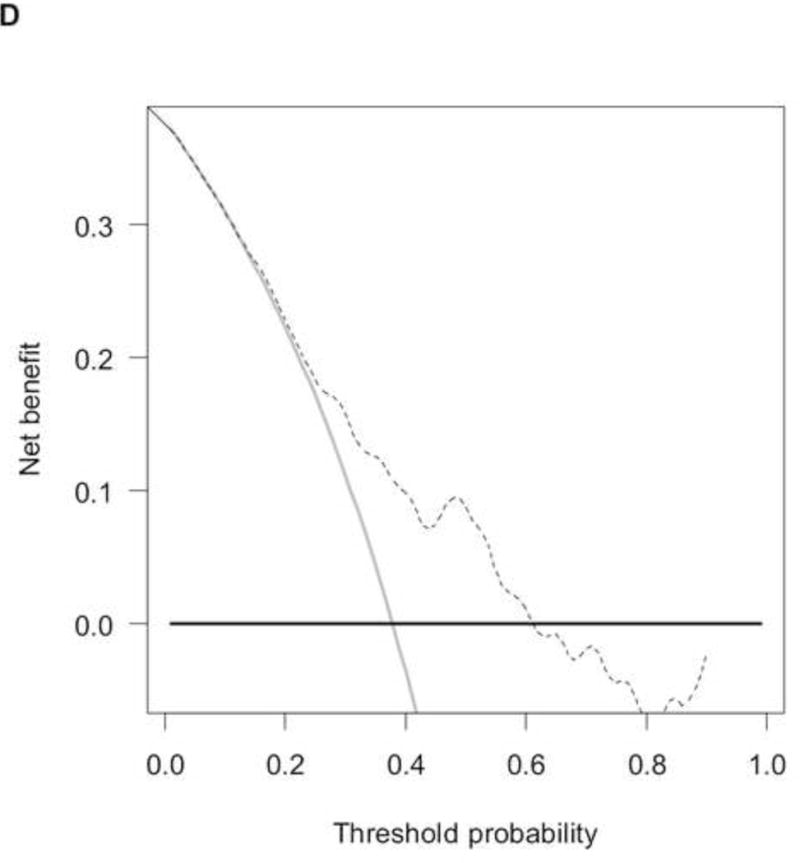
A) RISC2 nomogram to predict individual patient-level 1-, 2-, and 5-year overall survival based on the response to first-line chemotherapy added to the total score from RISC1. B) Calibration plots for the validation sample of the RISC2 nomogram, estimated at 12 months, and C) 24 months. D) Decision curves for overall survival at 12- and 24- (E) months applied to the RISC2 nomogram.
Legend: solid thin line: net benefit of a strategy of treating all patients; solid bold line: net benefit of treating no patients; dotted line: net benefit of a strategy of treating patients according to the nomogram predictions.
Abbreviations: CR: complete response; CT: chemotherapy; PD: progressive disease; PR: partial response; NA: not available; RISC1: nomogram with baseline factors from the Retrospective International Study of Invasive/Advanced Cancer of the Urothelium database; SD: stable disease.
