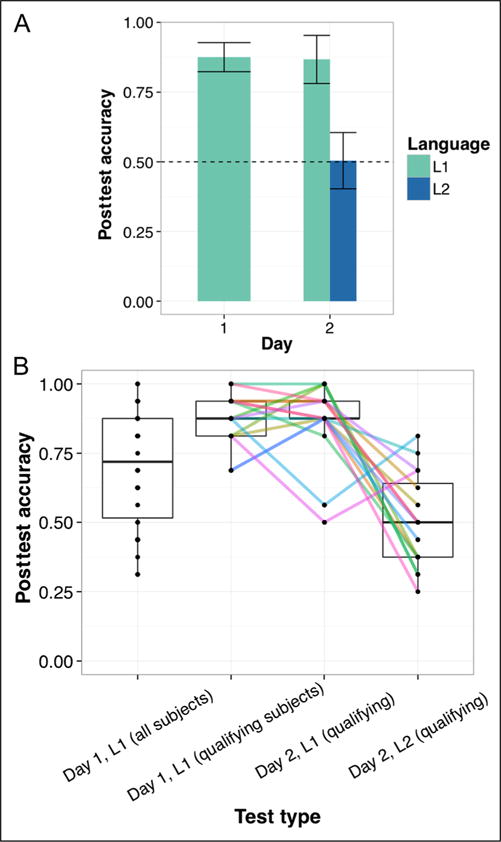
Figure 3.

Mean posttest scores for qualifying participants (A) and the spread of individual participant performance across testing days (B). Note that even after exposure to L2, qualifying participants tended to maintain their L1 representations in the Day 2 scanning session. Error bars in A represent 1 SEM corrected for within-subject comparisons, and colored lines in B indicate individual trends in performance across tests.
