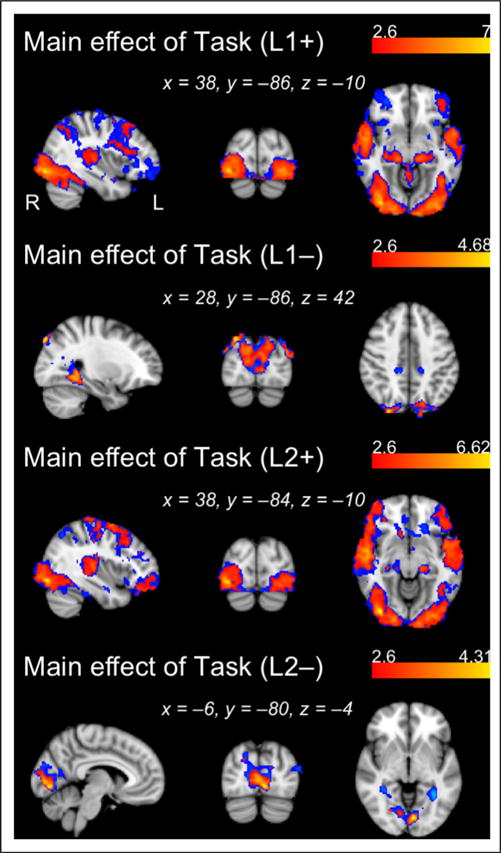
Figure 4.

Regions showing positive and negative main effects of Task for each language, L1 and L2 (see also Table 2). Activation maps generated with a cluster-determining threshold of Z > 2.6 are overlaid (in red) onto activation maps generated using Z > 1.96 (in blue).
