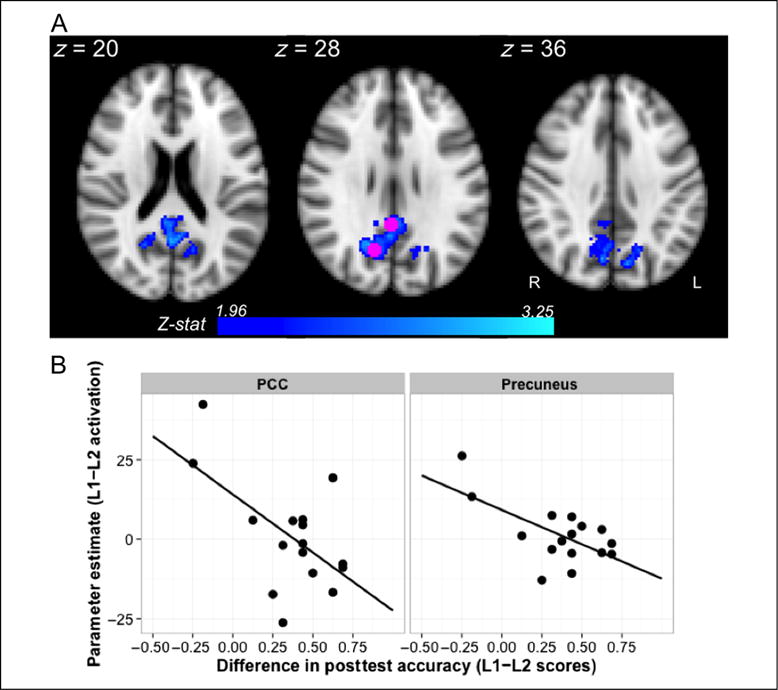
Figure 5.

Inverse relationship between L1 versus L2 activation and the strength of the primacy effect measured behaviorally. Activation in PCC and precuneus was modulated by differences between L1 and L2 posttest accuracy (A; Z > 1.96, p < .05). As illustrated in B, lower L1 relative to L2 activation in these regions was related to a stronger primacy effect. To create the bottom plot, parameter estimates for each participant were extracted using the group level peaks in right precuneus and PCC, shown in pink, and plotted against individual difference scores (L1–L2). Negative values on either axis indicate lower L1 activation relative to L2 (y axis) or lower L1 accuracy relative to L2 (x axis).
