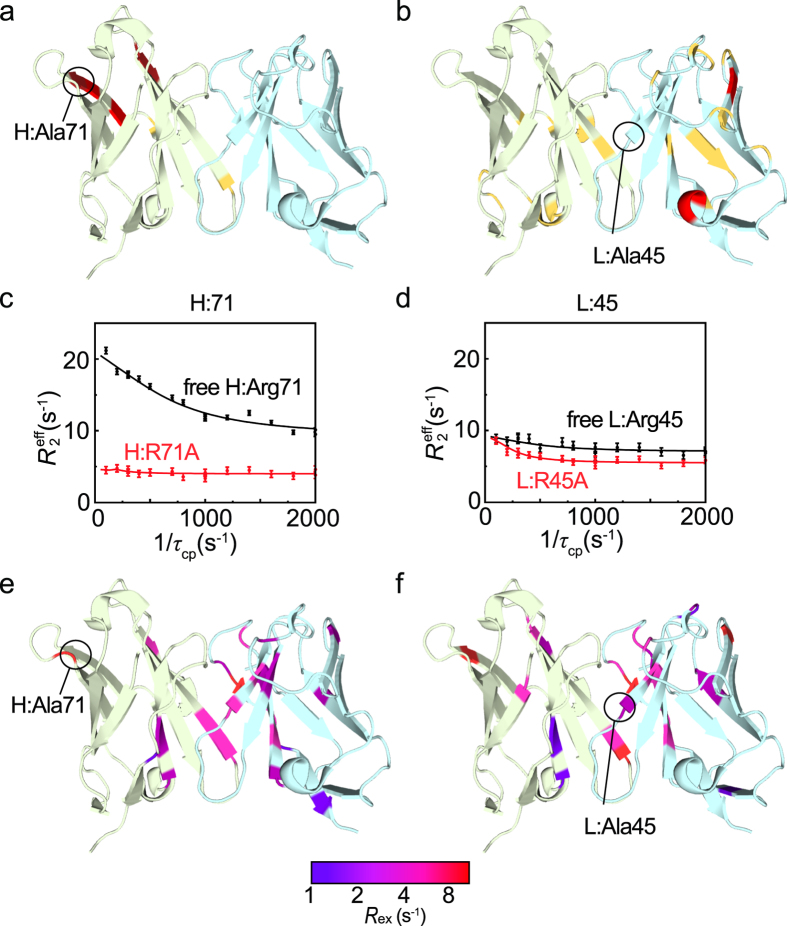
Figure 4.
Mutants with increased affinity have fewer fluctuating residues. (a,b) Magnitude of the chemical shift changes caused by the H:R71A (a) and L:R45A (b) mutations shown in yellow for those greater than the average and in red for those greater than the average plus one standard deviation. (c) Relaxation dispersion profiles of H:R71 in free WT (black) and H:A71 in free H:R71A (red). (d) Relaxation dispersion profiles of L:R45 in free WT (black) and L:A45 in free L:R45A (red). (e,f) Amplitude of the R ex rates for H:R71A (e) and L:R45A (f) mapped on the crystal structure of free HyHEL-10, as a continuous color scheme from purple to red. The VH and VL domains are shown in light green and light blue, respectively.

