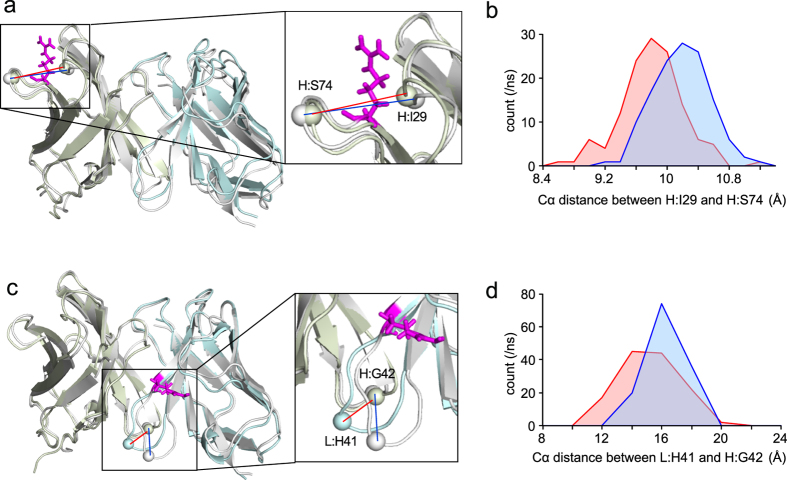
Figure 5.
Mutation changes the distribution of intra-atomic distances in MD simulations. The VH and VL domain of the mutants are shown in light green and light blue, respectively. The structure of WT is shown in gray. (a) The distances between the Cα atoms of H:Ile29 and H:Ser74 in H:R71A and WT are shown as a red line and a blue line, respectively. The H:Arg71 residue is depicted as a magenta stick. (b) The distance distribution between the Cα atoms of H:Ile29 and H:Ser74 was compared between WT (blue) and H:R71A (red) to estimate the distance change in the CDR-H3 and outer loop. The p value was 4.4 × 10⁻¹⁴. (c) The distances between the Cα atoms of L:His41 and H:Gly42 in L:R45A and WT are shown as in (a). The L:Arg45 residue is depicted as a magenta stick. (d) The distance distribution between the Cα atoms of L:His41 and H:Gly42 was compared between WT (blue) and L:R45A (red) to estimate the distance change between the loops in the VH and VL domains. The p value was 2.4 × 10⁻⁷.

