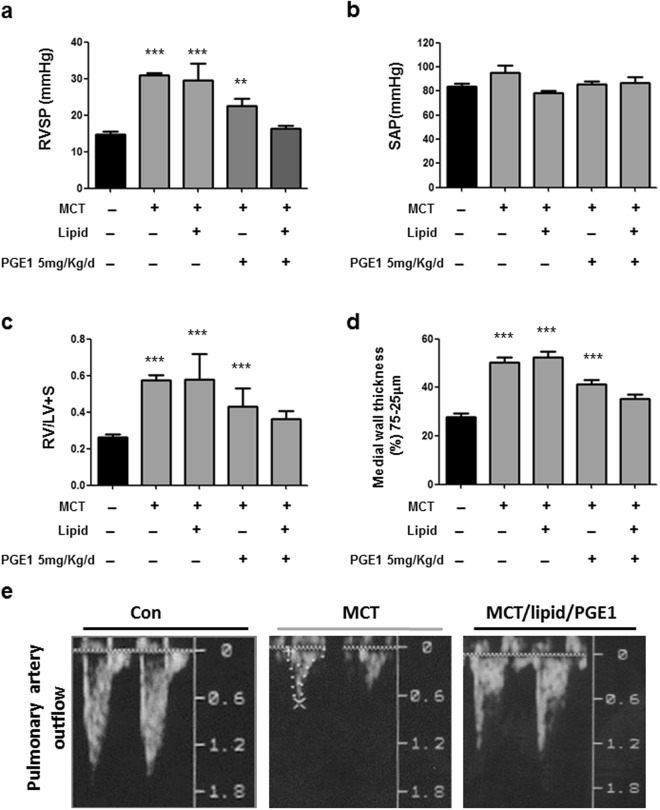
Figure 7.
Effects of PGE1 on pulmonary hemodynamics and pulmonary arterial hypertrophy. The right ventricle systolic pressure (RVSP) (a) and systemic arterial pressure (SAP) (b) measurements for 5 different groups are shown. Pulmonary hypertension (indicated by elevated RVSP) was established 28 days after MCT injection with or without PGE1 treatment and lipid/PGE1 (5 mg/kg/d administered i.p. from day 7 to day 28). The MCT/lipid/PGE1 groups exhibited reduced RVSP compared with the MCT-treated group but not reduced SAP. The ratio of RV to LV plus septum weight (RV/LV + S) is shown (c). The medial wall thickness of the small pulmonary arteries (25–75 μm) identified by α-SM-actin staining (brown staining) is shown (d). The degree of medial wall thickness was compared among the 5 groups. The mean±SEM (n = 4–8 in each group) is expressed for each group. (e) The pulmonary artery outflow measured by echocardiography is shown. ***P < 0.001 versus the control group, one-way ANOVA with Bonferroni’s post -hoc test.

