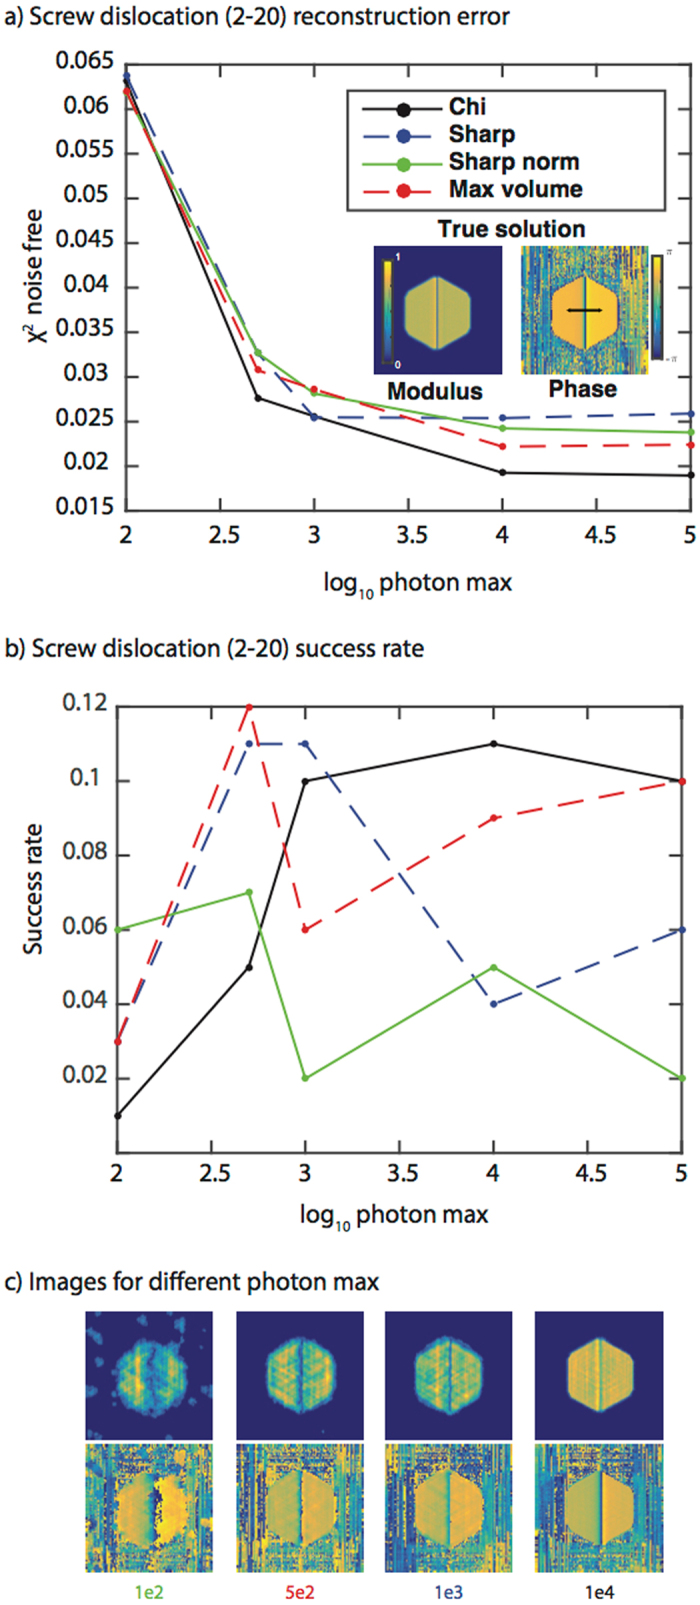
Figure 3.

Fitness metric results for a perfect screw dislocation measured at a (2–20) Bragg peak. (a) A plot of the modulus error vs. log10 of the photon max for the four fitness metrics. The modulus error (χ2) is computed with respect to the noise-free data and averaged over the 100 trials. A 2D cross-section of the true solution modulus and phase is shown as an inset. The colorbars apply to all modulus and phase cross-sections in the figure. The black arrow shows the phase wrap direction in the image. (b) A plot of the success rate (over 100 trials) for the four fitness metrics as a function of photon max. The legend is the same as in (a). (c) The best-correlated images obtained using the metric with the highest success rate for different photon max. The color of the photon max number at the bottom of the image corresponds to the most successful metric. The metrics with the highest success rates are: 1e2 – Sharp norm, 5e2 – Max volume, 1e3 – Sharp, 1e4 – Chi, 1e5 – Chi/Max volume (not shown). Note that 3D reconstructions were performed although 2D cross-sections are shown.
