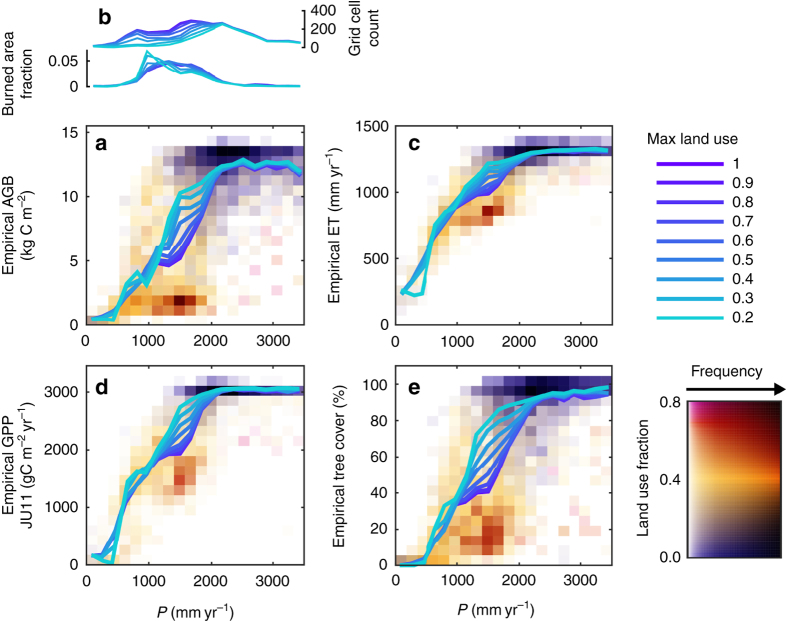
Fig. 4.
Functional relationships and their dependency on land use. a Dependency of above ground biomass (AGB) on precipitation (P). Coloured frequency field shows the dependency of AGB on P and land use. Colour follows the mean land use fraction in a P-AGB bin, and the saturation describes relative frequency. Coloured lines represent the functional relationships, found when averaging AGB over P-bins. The colours describe the maximum land use fraction of the grid cells included in the calculations of the functional relationships; from all grid cells (1) to only include grid cells with land use fraction lower than 0.2. This procedure was repeated for burned area fraction which is shown in b together with the number of grid cells available per land use limit. c through e show the corresponding frequency fields and functional relationships of evapotranspiration (ET) c, gross primary productivity (GPP) d and tree cover e. For ET c the spatial distribution of mean ET and P were calculated from the three data sets before the analysis of the functional relationships, where P differ only in the time period used for the climatology (individual panels for the three ET data sets are shown in Supplementary Fig. 3)

