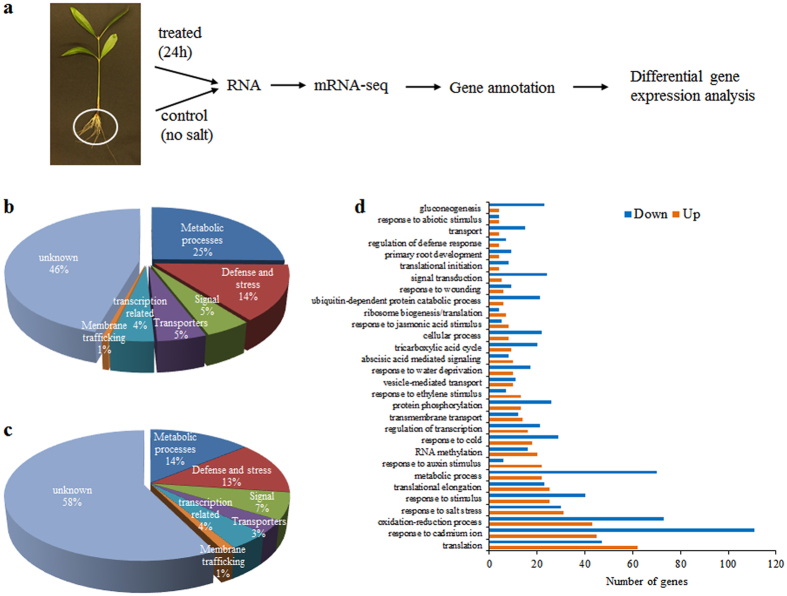
Figure 1.
Transcriptome analysis from A. officinalis roots. (a) Schematic of transcriptome analysis from A. officinalis roots (b) percentage of up-regulated and (c) down-regulated unigenes classified based on their GO function. (d) GO enrichment analysis of DEGs. The top 30 abundantly enriched GO terms that were differentially expressed are represented in the plot. X-axis indicates the number of DEGs enriched. Y-axis indicates the GO term.

