Figure 3.
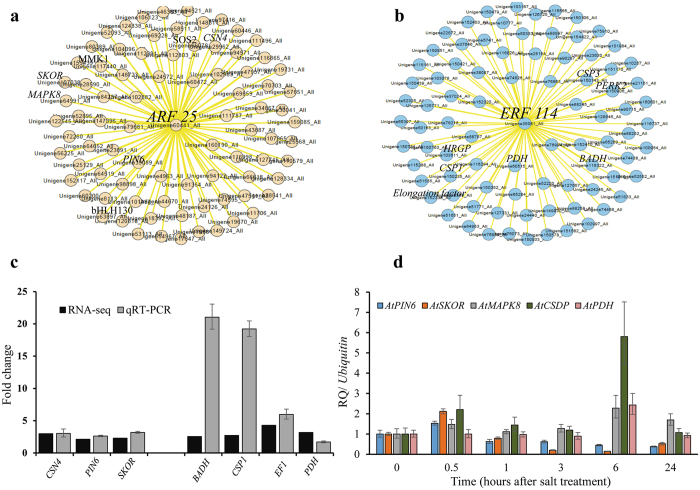
Gene network analysis using ARACNE and CYTOSCAPE. (a) Gene network analysis for AoARF25 and (b) AoERF114 is shown. Differentially expressed up-regulated genes were extracted from the RNA sequencing data and gene networks for selected genes were constructed using Algorithm for the Reconstruction of Accurate Cellular Networks (ARACNE) algorithm. Based on ARACNE output, the final gene network graphs were created using Cytoscape. Highlighted in black color in each network are the names of genes that are known to be involved in respective signaling pathways. The validation of the expression profile of a few of the selected genes by qRT-PCR analysis is shown in (c) A. officinalis roots and (d) Arabidopsis roots. Relative expression levels of transcripts with reference to Ubiquitin 10 transcript levels are plotted, qRT-PCR data represent means ± SD, from 3 biological replicates. CSN4: COP9 signalosome complex subunit 4, PIN6: PIN-FORMED6, SKOR: stelar K + outward rectifying channel, BADH: betaine aldehyde dehydrogenase, CSP1: cold shock protein1, EF1: elongation factor 1-gamma 3, PDH: pyruvate dehydrogenase, MAPK8: mitogen activated kinase8, CSDP: cold shock domain containing protein.

