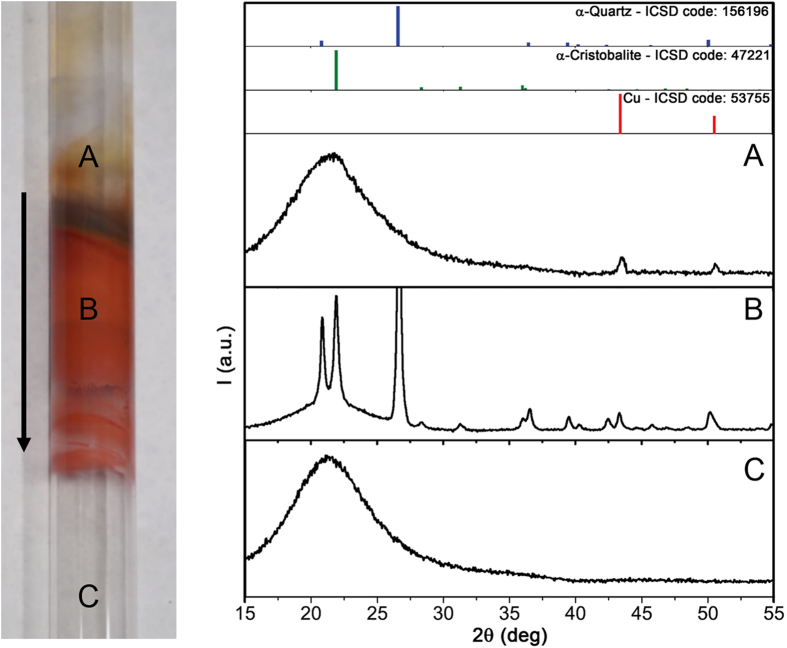
Figure 3.
XRD patterns taken in parts of the aged quartz tube (in the photograph, with the arrow indicating the gas flow direction) reaching different temperatures during the graphene growth process: (A) 570 °C, (B) 860 °C, (C) 1070 °C. Before the analysis the inner tube surface has been cleaned with nitric acid to remove the condensed Cu. The colors of the different tube regions (red for metallic Cu or cuprous oxide - Cu2O -, and black for cupric oxide - CuO) demonstrate the diffusion into the bulk quartz along a temperature gradient.

