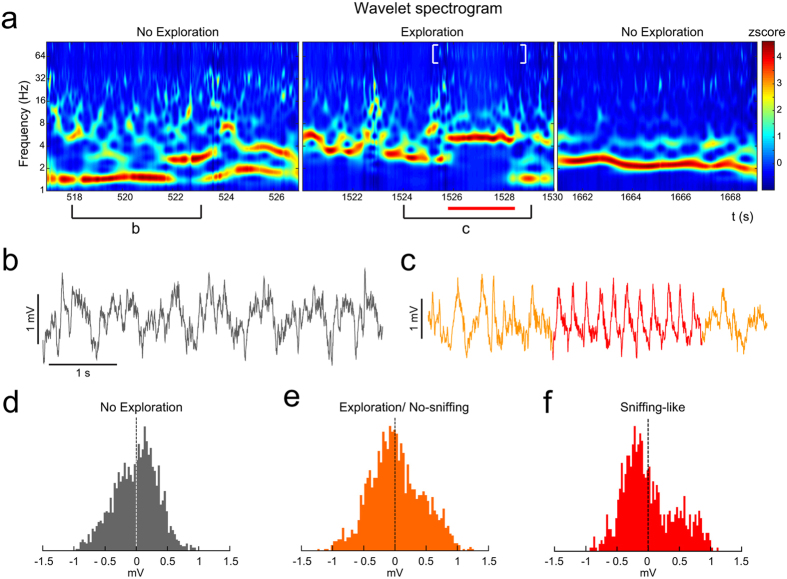
Figure 2.
Oscillatory changes induced by clean soiled bedding presentation. (a) Wavelet spectrogram of three different time periods in the AOB; left panel: non-exploration time; middle panel: exploration of a stimulus (red line indicating a sniffing-like oscillation and white brackets indicating gamma activity); right panel: non-exploration after the stimulus. Colour bar indicates the wavelet power coefficients (z-scored). (b) Raw trace during non-exploration time. (c) Raw trace during exploration time (in red indicating a sniffing-like oscillation). (d–f) Distribution of the amplitudes, with differential asymmetry of the waveform. (d) In a non-exploration time. (e) In an exploration/no-sniffing time. (f) In a sniffing-like oscillation present under exploratory behaviour.

