Figure 4.
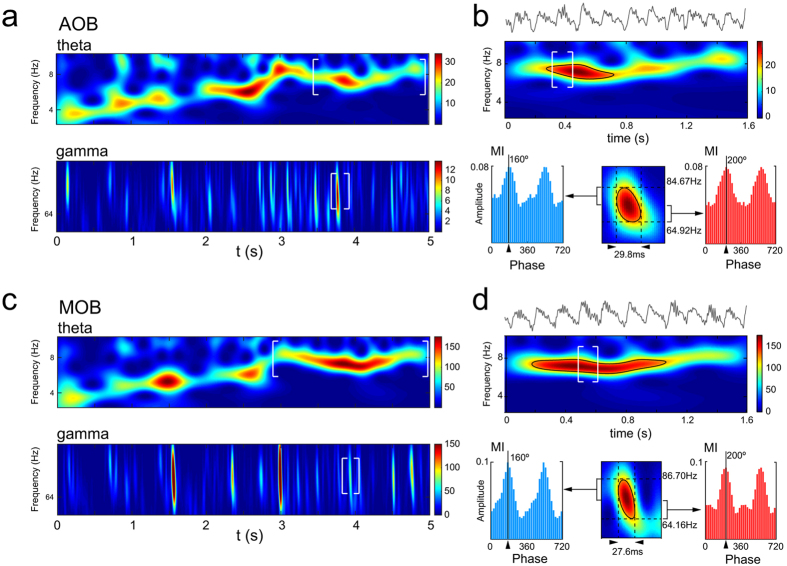
Olfactory-induced theta is associated with high and low gamma-oscillations in the AOB and MOB. (a) spectrogram of the theta (top) and gamma (bottom) bands; (b) Top, LFP trace and wavelet spectrogram of a sniffing-like period in the AOB (delimited with white brackets in (a). Colour bar indicates the wavelet power coefficients. Bottom: high to low gamma-oscillations wavelet analysis during theta-oscillation, delimited in white brackets in (a) (bottom) and (b) (top). High gamma is amplitude-phase coupled with the theta cycle phases at a prior phase than the low gamma. (c) and (d) Idem in the MOB.

