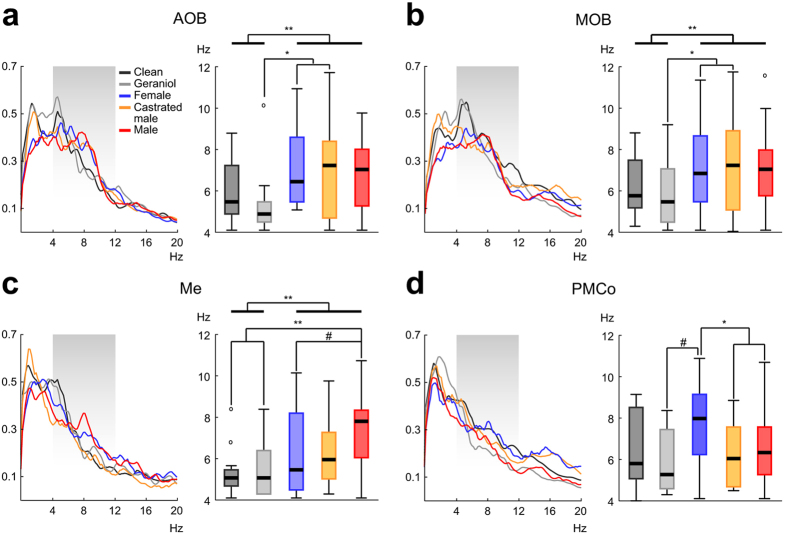
Figure 6.
Different stimuli induce unalike/distinctive peaks in the theta range. (a) Left: mean normalized power spectra of the AOB field recordings, the shaded area points the theta frequency band; Right: main peak distribution for the different stimuli, the thick lines show the comparison between the neutral and the conspecific derived stimuli (#p-value ∼ 0.05; *p-value < 0.05; **p-value < 0.01). Idem for the MOB (b), the Me (c) and the PMCo (d).

