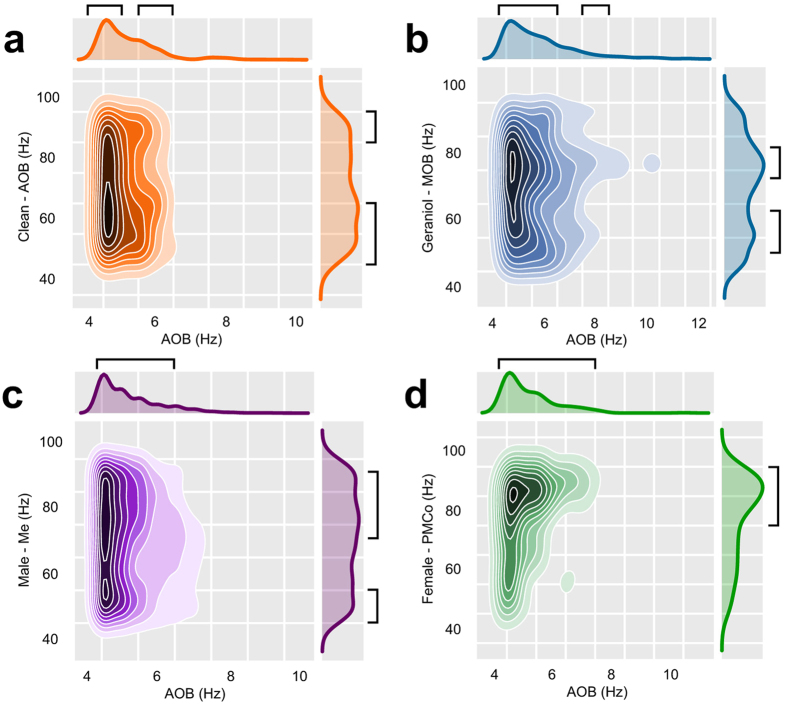
Figure 7.
Synchrony between the AOB and the AOB itself, the MOB, Me and PMCo. (a) Density plots of the points of modulation in the gamma band (AOB) induced by the theta frequencies (AOB) for clean bedding, calculated as the mean of the modulation values for all times in each recording, only values over the 70th percentile are shown. (b) Idem for the MOB, geraniol-scented bedding. (c) Idem for the Me, male-soiled bedding, showing the over 65th percentile values. (d) Idem for the PMCo, female-soiled bedding, showing the over 70th percentile values. Black brackets indicate the regions of interest.

