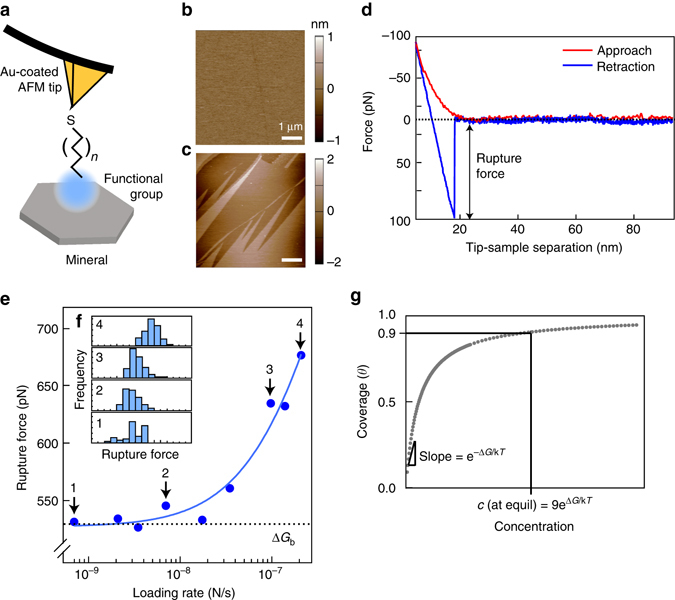
Fig. 2.

Dynamic force spectroscopy measurements at the organo–mineral interface. a Functional groups were covalently bound to gold-coated atomic force microscopy (AFM) tips and were used to probe mineral surfaces. Topographical AFM images of b the (001) surface of muscovite mica and c the (010) face of goethite (bottom) used in DFS experiments. Scale bars, 1 μm. d A representative force-distance curve and e a plot of mean rupture force versus loading rate showing increasing rupture force with increasing loading rate. The solid line represents a fit to the data using a theoretical model that accounts for both equilibrium and kinetic regimes of adsorption and forced desorption (See Eqs. 1–3, Methods section). Histograms (f, inset) of the force curves from individual points (1)–(4) show the trend of increasing rupture force with increasing loading rate. g To relate values of ΔG to typical measurements seen in adsorption experiments such as surface coverage, their relationship at equilibrium is shown in a model desorption isotherm. In the example, at a surface coverage of 90%, the value of ΔG is related through a simple exponential
