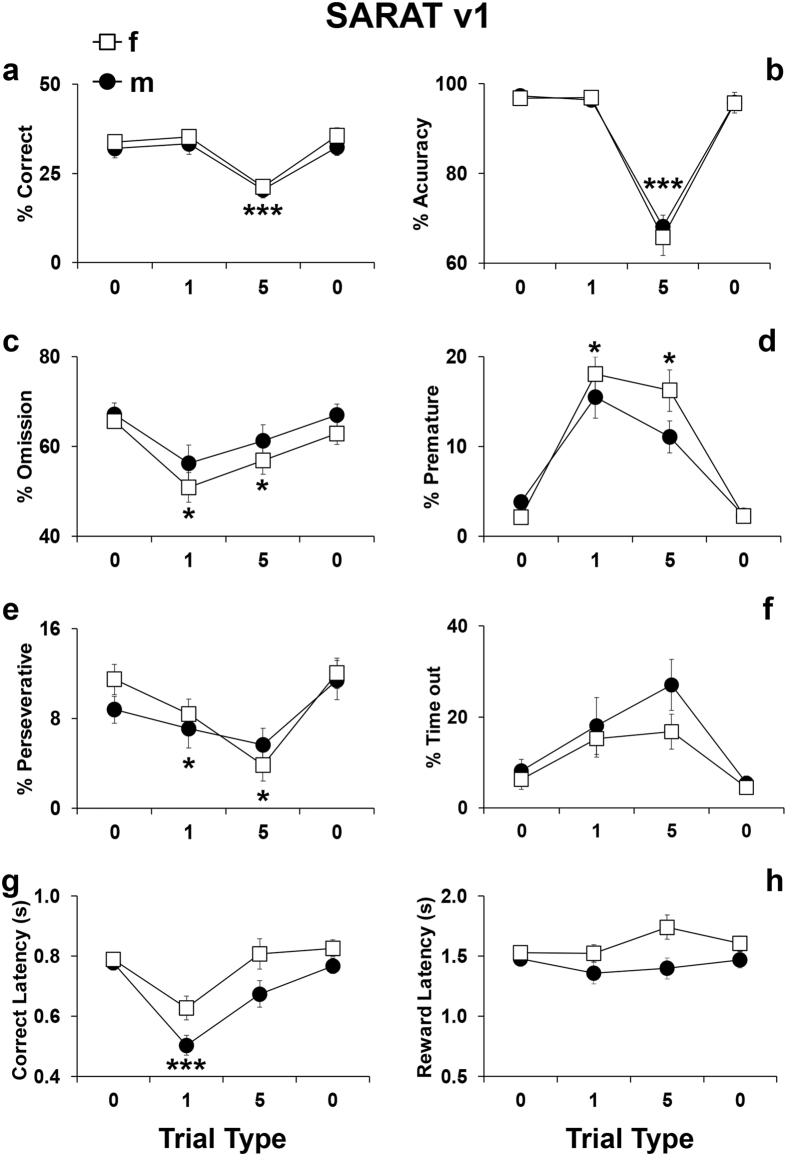
Figure 4.
Performance displayed by C57Bl/6J male and female adolescent mice during the SARAT test version 1. Percentage of (a) correct responses (correct responses/total number of trials*100), (b) accuracy (correct responses/(correct + incorrect responses)*100), (c) omissions (omitted trials/total number of trials*100), (d) premature responses (premature responses/(correct + incorrect + premature + perseverative + time-out responses)*100), (e) perseverative responses (perseverative responses/(correct + incorrect + premature + perseverative + time-out responses)*100), (f) time-out responses (time-out responses/(correct + incorrect + premature + perseverative + time-out responses)*100), (g) correct latency (time in seconds from onset of light stimulus to the performance of a correct response/number of correct responses) and (h) reward latency (time in seconds from the performance of a correct response to the retrieval of the food reward from the food magazine/number of correct responses). Data from consecutive sessions were averaged within each trial type. For clarity, the first depicted trial type represents the performance during the previous days of only Cued 0 trials, while the other two depicted trial types were the performance during the day of SARAT screening. Ns = 15 males and 14 females. *p < 0.05 and ***p < 0.0005 versus performance at all other trials type.

