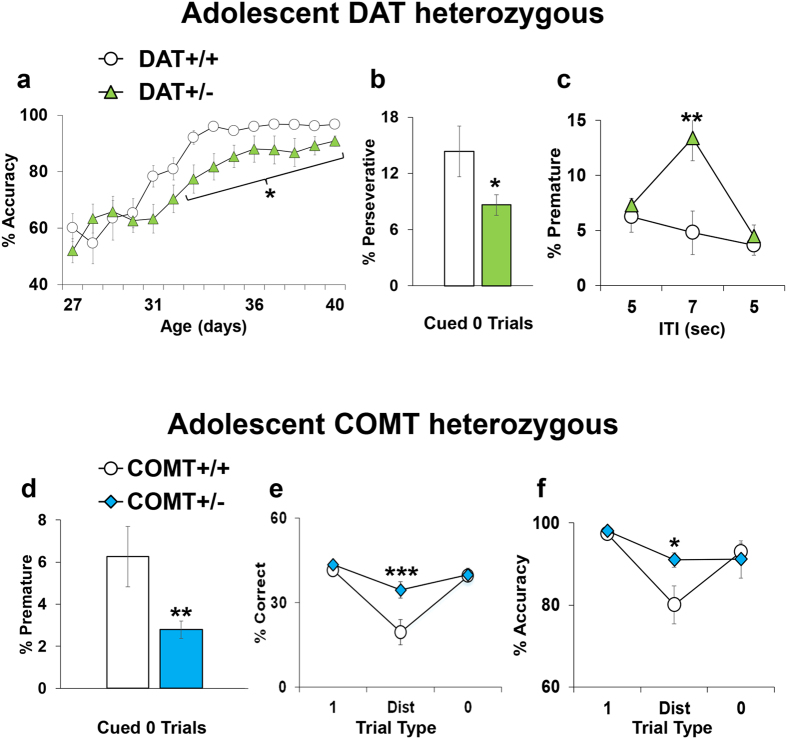
Figure 7.
(a–c) Performance displayed by DAT+/+ and DAT+/− adolescent littermates in the modified 5CSRTT in key parameters which showed a genotype effect. (a) Percentage of accuracy (correct responses/(correct + incorrect responses)*100) during the training phase of the test. (b) Percentage of perseverative responses (perseverative responses/(correct + incorrect + premature + perseverative + time-out responses)*100) during the basic phase of the test with only trial type 0 without any extra cue. (c) Percentage of premature responses (premature responses/(correct + incorrect + premature + perseverative + time-out responses)*100) during the 5–7 ITI challenge paradigm. DAT+/+ Ns = 12, DAT+/− Ns = 12. *p < 0.05 and **p < 0.005 versus performance of DAT+/+ at the same trial type. (d–f) Performance displayed by COMT+/+ and COMT+/− adolescent littermates in the modified 5CSRTT in key parameters which showed a genotype effect. (d) Percentage of premature responses (premature responses/(correct + incorrect + premature + perseverative + time-out responses)*100) during the basic phase of the test with only trial type 0 without any extra cue. (e) percentage of correct responses (correct responses/total number of trials*100) and (f) accuracy (correct responses/(correct + incorrect responses)*100) during the Distractor paradigm. Ns: COMT+/+ = 7 and COMT+/− = 8. *p < 0.05, **p < 0.005 and ***p < 0.0005 versus performance of COMT+/+ at the same trial type.

