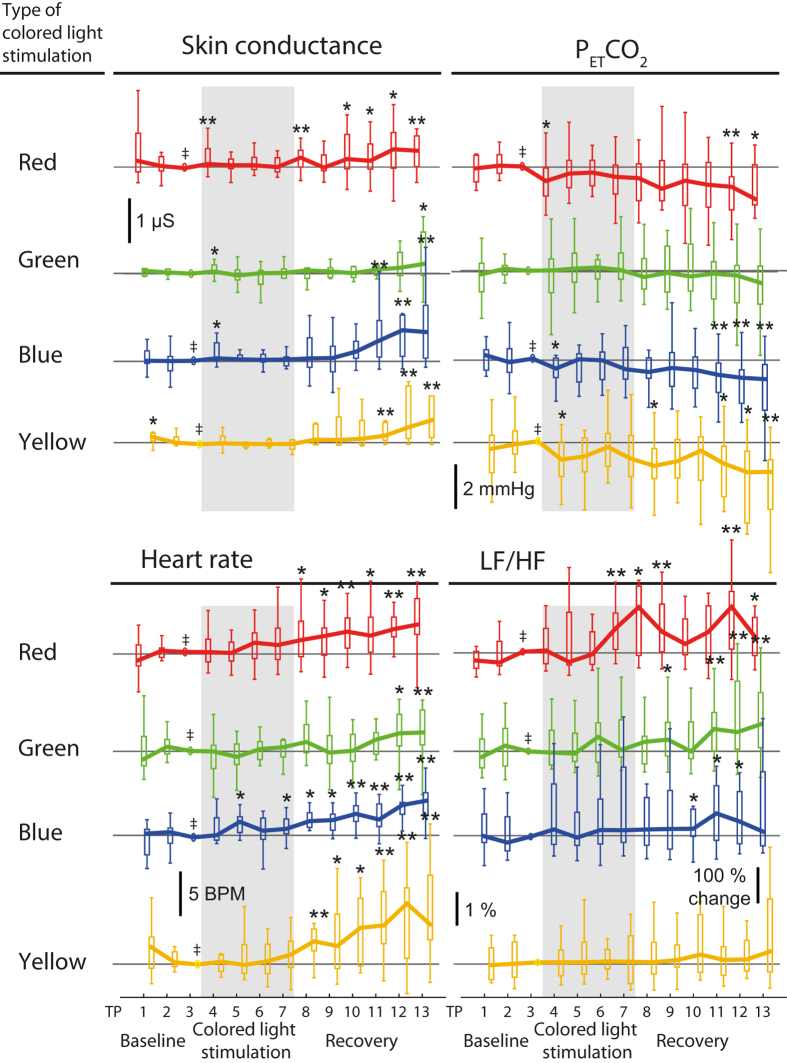
Figure 1.
Paired changes of skin conductance (SC), PETCO2, HR and the LF/HF ratio calculated from ECG data. Each panel includes a time series for each colour, as denoted. The time series are sub-divided into thirteen 2.5 min periods. The two bold vertical lines mark the light exposure period (Colour Stimulation). Time series are always normalized (subtracted, or for LF/HF divided by) to the last time point of the baseline (TP3). Hence the horizontal lines represent zero (one for LF/HF). ‡Indicate significance of a change throughout the whole times series (Friedman tests and FDR correction, SC: p all < 0.03, PETCO2: p all < 0.05, HR and LF/HF: p all < 0.01). Asterisks indicate a significant change of the marked time point with respect to TP3 (Wilcoxon signed rank tests, uncorrected). Outliers are not displayed. TP: time point, BPM: beats per minute. HR: heart rate. ECG: electrocardiogram.

