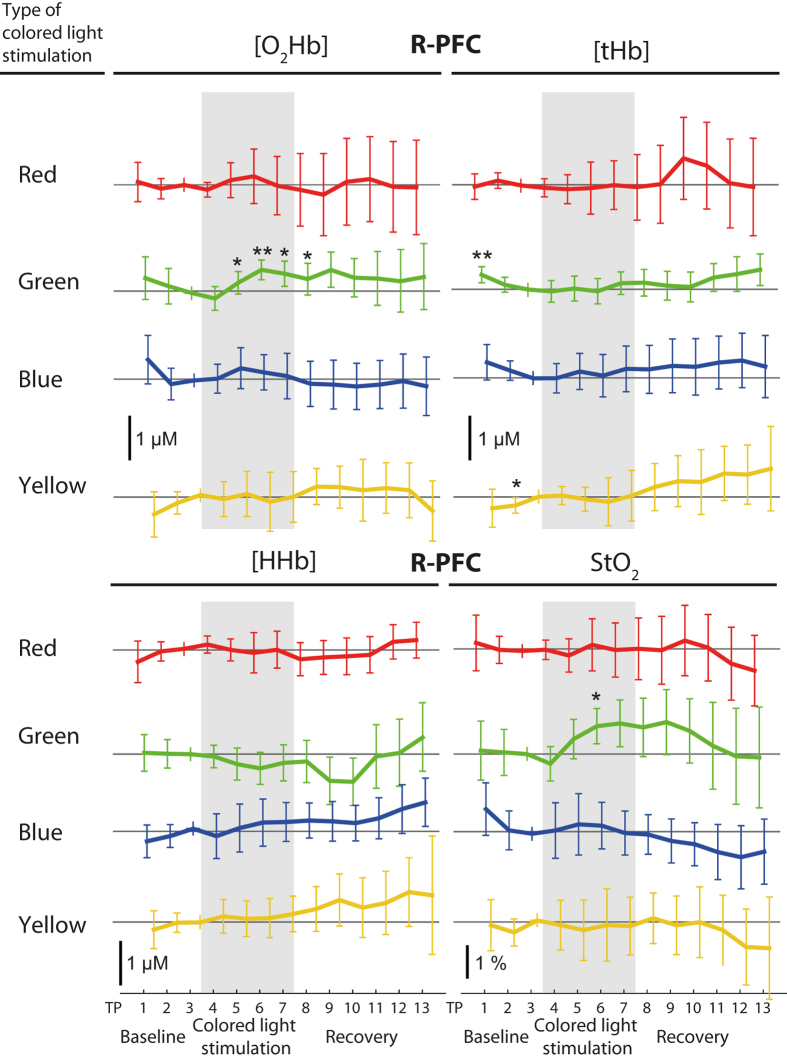
Figure 3.
Paired fNIRS changes in the R-PFC evoked by light of different colours, i.e. red, green, blue, yellow. Each panel includes four time series, one for each colour condition, as denoted. The different time series are arbitrarily shifted for visibility. All time series were normalized (subtraction) to the last time point of the baseline (TP3), thus this time point is always zero. Division of the time series, vertical bars, ‡ and asterisks are as in Fig. 1. Error bars represent the 95% confidence interval.

