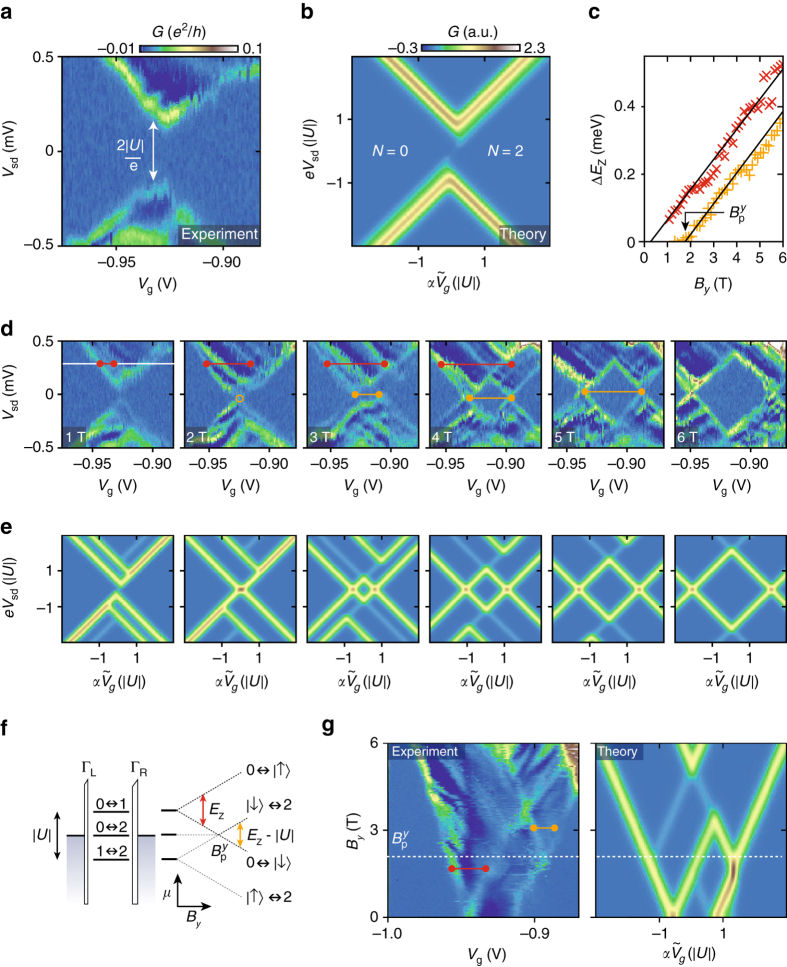
Fig. 2.
Excited state spectroscopy. a Bias spectroscopy in the region of a single-pair transition shown in Fig. 1d. The transport gap |U|=160 μeV is indicated. b Corresponding transport calculation of the bias spectroscopy based on a single-orbital Anderson model with attractive interactions and occupation N. c Zeeman energy splitting ΔE Z extracted from measurements in d, g. The energies for the ground (excited) state transitions are indicated by orange (red) markers. The linear fits yields |g|=1.5 and intercept . d Evolution of the bias spectroscopy measurements with magnetic field B y with corresponding calculations shown in e. The color scales for d, e are as in a, b, respectively. f Schematic illustration of the electrochemical potentials for the relevant transitions in the QD and their evolution with magnetic field. For the splitting of the ground state, ΔE Z=E Z−|U| (orange line), and for the splitting of the excited state (red line) ΔE Z=E Z, where E Z=gμ B B y is the Zeeman energy. The associated features are indicated in the bias spectra (d, g) by orange/red lines. g Measured and simulated magnetic field dependence of G(V g) at V sd=300 μeV (white line in b), highlighting the magnetic field dependence of the excited state spectrum

