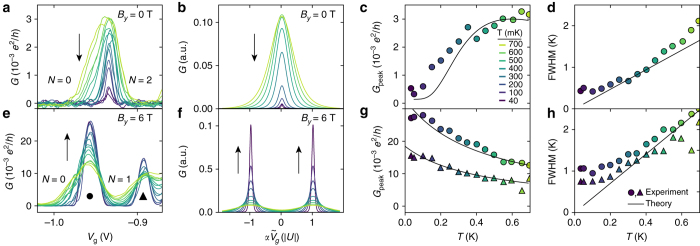
Fig. 3.
Temperature dependence of zero-bias conductance. a G(V g) for varying temperature T at B y=0 T. N labels the occupation of the orbital, and the color coding of the different temperatures relevant for all panels is shown in c. b Corresponding theory calculations based on the negative-U Anderson model. Arrows indicate the qualitative temperature dependence of the peak conductance. c The temperature dependence of the fitted conductance peak amplitude G peak and d full width at half maximum (FWHM). The results of the simulations are shown as solid lines. e–h Shown are the results corresponding to a–d measured with B y=6 T, where transport is dominated by conventional sequential tunneling. The resonance peak has split into two peaks indicated by markers • and ▲

