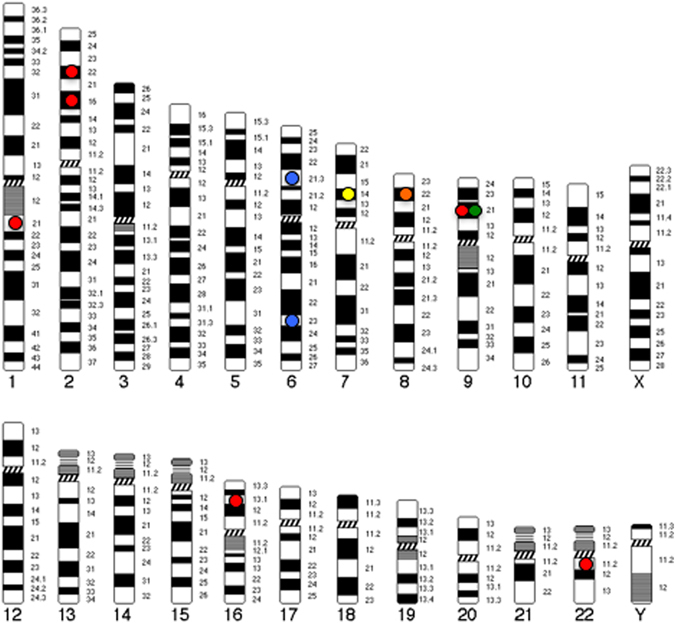
Fig. 1.

Genomic map of top loci identified in genome-wide studies of schizophrenia and related phenotypes within the Japanese population. Circles indicate candidate loci and color represents phenotype (Red circle=schizophrenia; Green circle=cognition; Yellow circle=atypical psychosis; Orange circle=methamphetamine-induced psychosis; Blue circle=antipsychotic response/adverse event). Genes (genomic regions) presented include: SULT6B1 (2p22.2); ELAVL2 (9p21.3); DEGS2 (14q32.2); TEK (9p21.2); CHN2/CPVL (7p14.3); SGCZ (8p22); PDE7B (6q23.3); PBX2 (6p21.32); NRXN1 (2p16.3); 16p13.1; 1q21.1, 22q11.21
