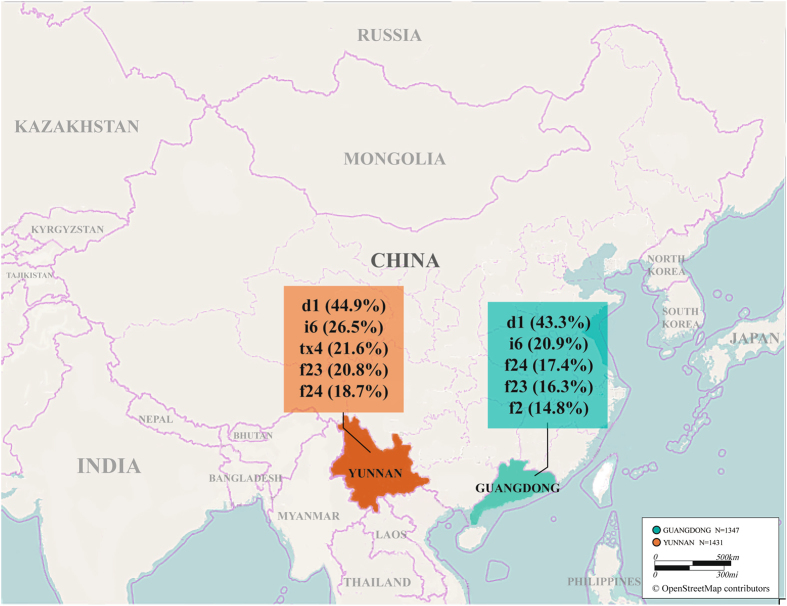
Figure 1.
Sensitization to individual allergens in Guangdong and Yunnan. The first five leading allergens in Guangdong were d1 (43.3%, 95% CI: 41.4%, 45.1%), i6 (20.9%, 95% CI: 19.4%, 22.4%), f24 (17.4%, 95% CI: 14.3%, 20.5%), f23 (16.3%, 95% CI: 14.9%, 17.7%), and f2 (14.8%, 95% CI: 13.5%, 16.1%), compared with d1 (44.9%, 95% CI: 43.0%, 46.7%), i6 (26.5%, 95% CI: 24.8%, 281%), tx4 (21.6%, 95% CI: 18.2%, 25.0%), f24 (20.8%, 95% CI: 17.5%, 24.1%), and f23 (18.7%, 95% CI: 15.5%, 21.9%) in Yunnan. The figure was generated from OpenStreepMap® (http://www.openstreetmap.org/), modified and annotated with Adobe Illustrator CS6 (Adobe, San Jose, California, USA). The cartography in this figure is copyrighted by © OpenStreetMap contributors, and licensed under the Creative Commons Attribution-ShareAlike 2.0 license (CC BY-SA). For permission to use this map from OpenStreepMap®, please refer to: http://www.openstreetmap.org/copyright/en. d1: house dust mite; i6: cockroach; tx4: tree pollen mix; f23: crab; f24: shrimp; f2: milk.

