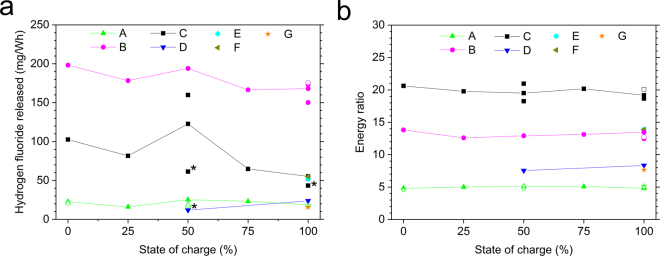
Figure 2.
Total amount of HF measured by FTIR, normalized to nominal electrical energy capacity (a) and the energy ratio (b), for seven types of Li-ion battery cells and with various state of charge levels. Non-filled symbols indicate a repetition variant, e.g. applying water mist. The lines are intended as a guide for the eye. The energy ratio is a dimensionless value calculated by taking the total heat release from the battery fire divided by the nominal electrical energy capacity. Note that for 100% SOC the values are overlapping for type C, E and F as well as for type A, D and G in (a) and type B, E and F in (b). *Low value for type C at 50% and 100% SOC and type D at 50% SOC due to that a pre HF-saturation was not applied, therefore a part of the HF release was likely to be saturated in the gas sampling system, see Methods.

