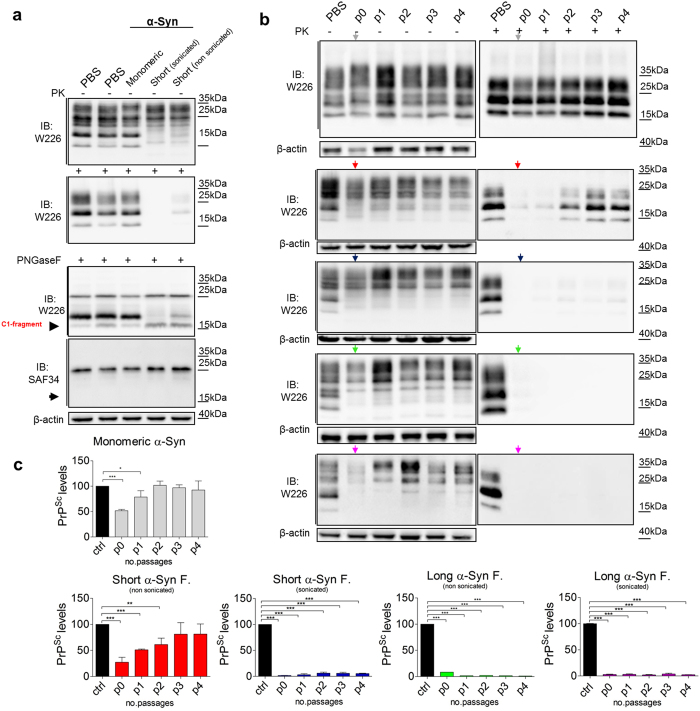
Figure 4.
Clearance of PrPSc from RML prion-infected cells in the presence of α-Syn amyloids. (a) PrPSc levels in ScN2a cells were measured by immunoblotting after four days of culture in the presence of different α-Syn preparations (monomeric and fibrillar α-Syn). (b) Western blot analysis of PK-resistant PrPSc in ScN2a cell lysates after treatment with monomeric α-Syn (grey arrow) or different α-Syn amyloids (short non-sonicated fibrils, red arrow; short sonicated fibrils, blue arrow; long non-sonicated fibrils, green arrow; long sonicated fibrils, magenta arrow) over four serial passages. (c) Quantification of three independent experiments. The values are shown as a percentage of PK-resistant form relative to total PrP/β-actin. β-Actin is a loading control. Data are represented as mean ± SD. Data were evaluated by unpaired Student’s t-test. Statistical analysis is indicated as: *P < 0.05, **P < 0.01, ***P < 0.001.

