
Figure 4.
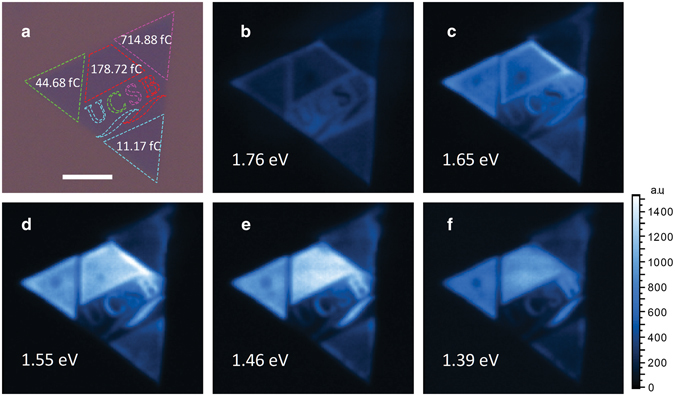
PL mapping on electron beam irradiated sample with a designed pattern under 632.81 nm laser with 1472.83 kW/cm2 laser power. (a) The optical microscope image of the sample overlapped with the designed pattern with 4.18 nm lattice spacing. The colors of the dashed lines encompassing the four regions (and in “UCSB”), blue, green, red and pink correspond to 11.17 fC, 44.68 fC, 178.72 fC, and 714.88 fC, respectively. (b–f) are the PL mapping for 1.76 eV, 1.65 eV, 1.55 eV, 1.46 eV, and 1.39 eV, respectively. The white scale bar is 10 m.