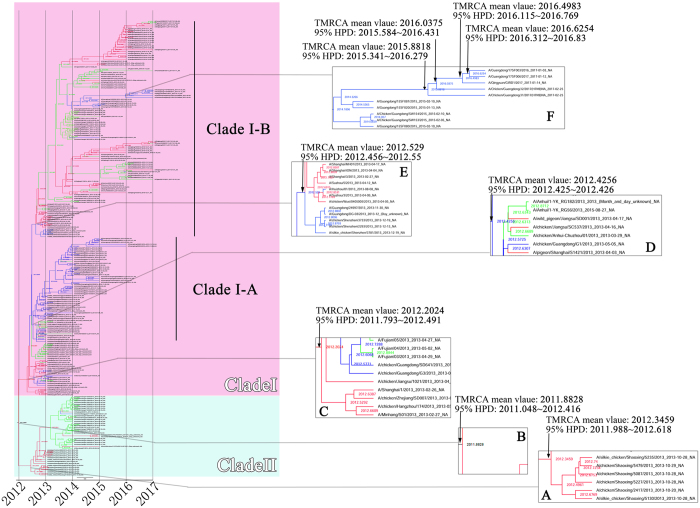
Figure 4.
Bayesian maximum clade credibility (MCC) phylogeny of N9 gene sequences of waves 1 to 5. Viruses isolated in the Yangtze River Delta, Pearl River Delta, and other regions are highlighted in red, blue, and green, respectively. BEAST tree of H7N9 viruses estimated using NA gene sequences. Pink shadow indicates Clade I of H7N9 viruses; light blue represents Clade II. Figure 4A, time of most recent ancestor (TMRCA) of Clade II; Fig. 4B, TMRCA of the entire tree. Figure 4C, TMRCA of Clade I. Figure 4D, TMRCA of the Clade I-A lineage. Figure 4E, TMRCA of the Clade I-B lineage. Figure 4F, TMRCA of the lineage containing H7N9 viruses detected in avian or humans with HP characteristic cleavage site.

