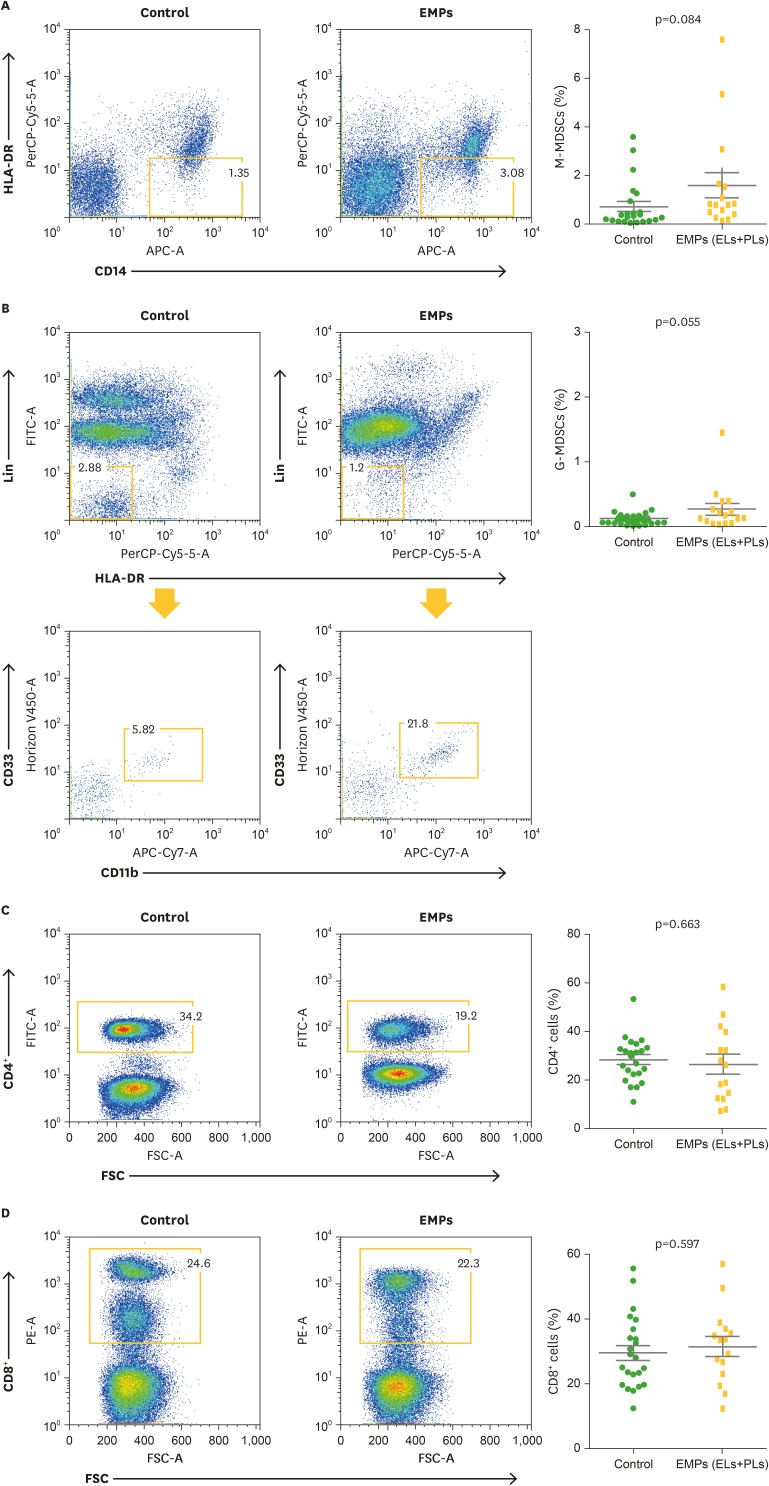
Figure 3.
Comparison of immune cell populations between patients with newly diagnosed MM without EMPs (control group) and with EMPs (ELs+PLs). Frequencies of M-MDSCs (A), G-MDSCs (B), CD4+ T cells (C), and CD8+ T cells (D) were compared. Data (right panel) are presented as the mean±SEM, and t-tests were used to compare the continuous variables.
SEM, standard error of the mean.

