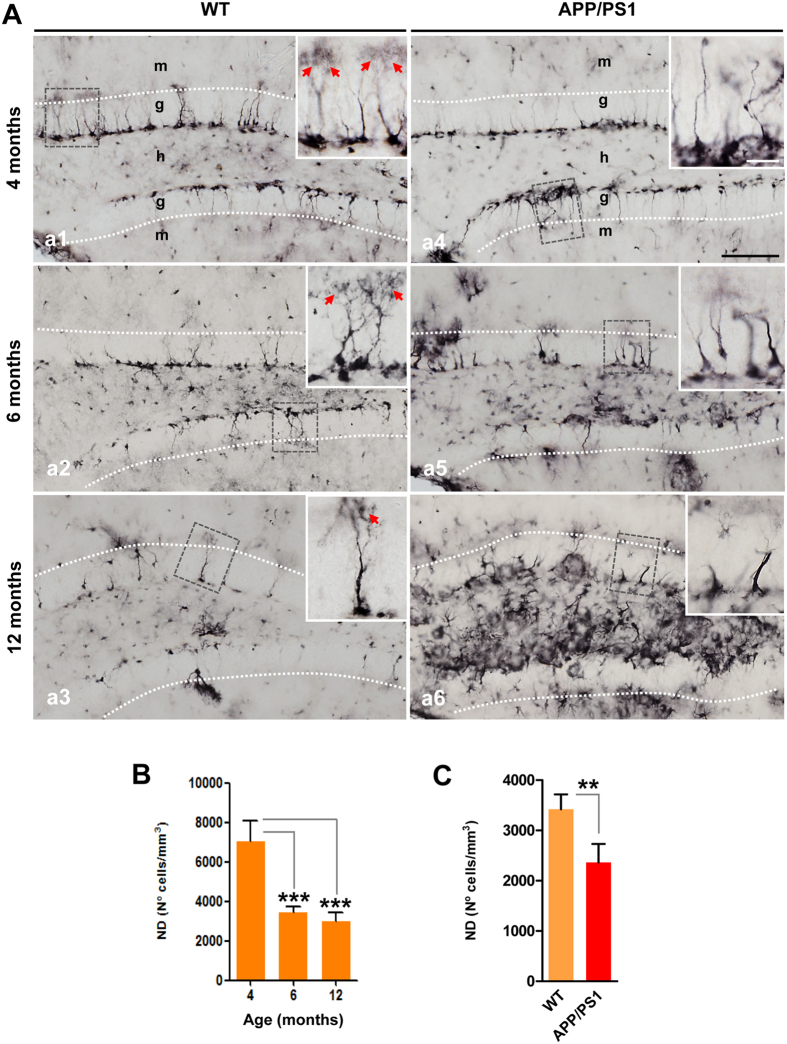
Figure 4.
BLBP-positive stem cells are reduced in aging and in APP/PS1 mice. (A) Light microscopic images of the dentate gyrus of WT (a1–a3) and APP/PS1 (a4–a6) mice immunostained for BLBP. (B) Stereological quantification demonstrates an age-depend decrease in BLBP-positive cells (n = 4/genotype/age; ANOVA F(2,8) = 38.93, Tukey’s post hoc test, ***p < 0.001). (C) Stereological quantification shows a significant decrease in the number of BLBP-cells in APP/PS1 mice compared to age-matched WT mice (n = 4/age/genotype; t-test **p < 0.01). Red arrows: BLBP-positive stem cells with broccoli-like cell endings. g: granular cell layer; h: hilus; m: molecular cell layer. Scale bars: 100 μm (a1–a6), 25 μm for inserts.

