Figure 7.
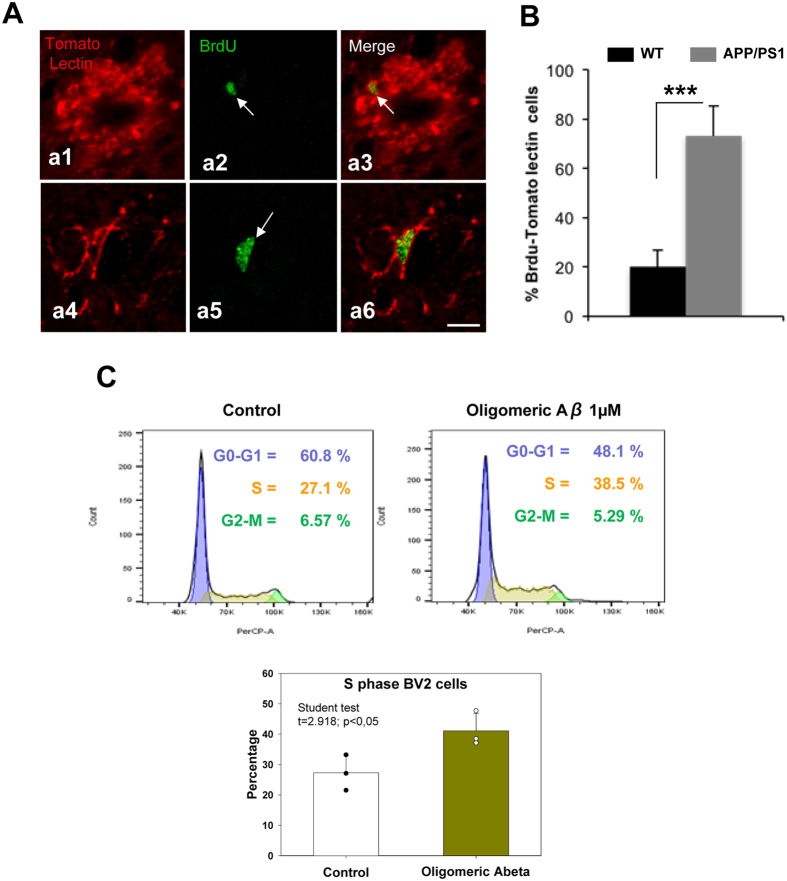
The microglial population increases in the dentate gyrus of APP/PS1 mice. (A) Double immunofluorescence confocal images for tomato lectin/BrdU (a1–a6) in 6-month-old APP/PS1 mice. The corresponding merged images showed that the BrdU-cells (arrows) observed in the hilus corresponded to microglial cells. (B) Quantitative analysis shows a significant increase of tomato lectin/BrdU double-labeled cells in APP/PS1 mice compared to WT mice (n = 6/genotype; t-test ***p < 0.001). (C) Bv2 proliferation assay shows an increase of proportion of microglia cells in S phase after Aβ treatment. (D) Proliferation index ratio shows a significant increase (showing in the graph) in Bv2 cells treatment with soluble oligomeric Aβ compared to control. Scale bars: 10 μm.

