
Fig. 2.
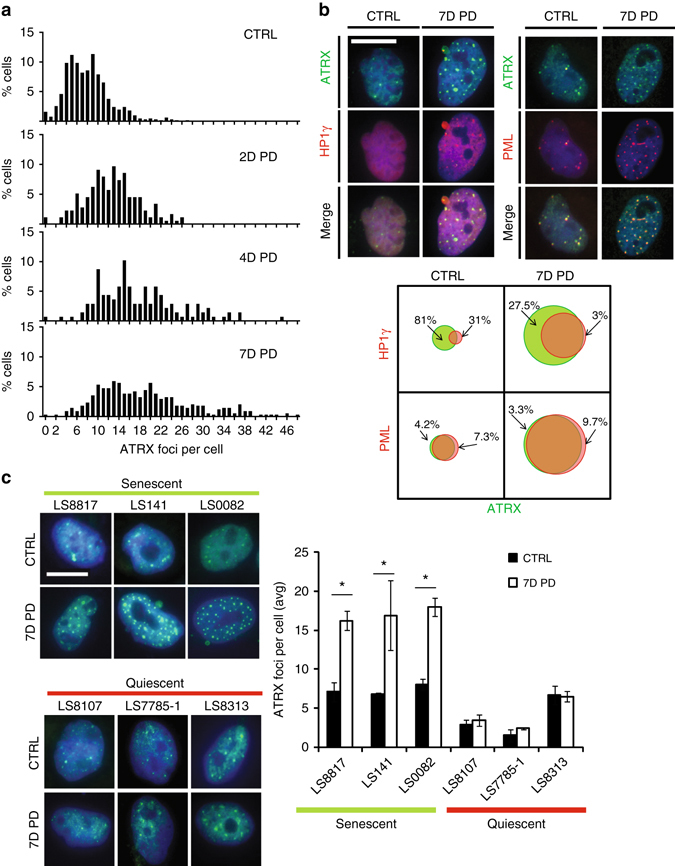
ATRX accumulates in nuclear foci in senescent cells that colocalize with HP1γ SAHF. a LS8817 cells were treated with PD0332991 for the indicated number of days, fixed and subsequently stained with ATRX antibodies. The number of ATRX foci in each cell (>150 cells per graph) were counted and plotted. The percentage of cells with a number of foci is indicated on the y-axis. b LS8817 cells were treated with PD0332991 for 7 days and the co-localization of HP1γ (left) or PML foci (right) with ATRX foci determined by immunofluorescence. Representative images are shown. The fraction of ATRX foci co-localized with either HP1γ or PML foci was quantified in control and treated cells. Circles in the Venn diagrams are drawn to scale relative to the number of the indicated foci in each condition. c The indicated liposarcoma cell lines were treated with PD0332991 for 7 days as previously described35. The outcome of this treatment vis a vis quiescence or senescence is indicated. ATRX foci were detected by immunofluorescence and the average number of foci per cell is plotted (right). Representative images are shown on the left. All data are represented as mean ± SEM from at least 3 independent experiments. Asterisk indicates p < 0.05 using a two-sided Students t-test. All images were taken at the same magnification. The scale bar is 20 microns