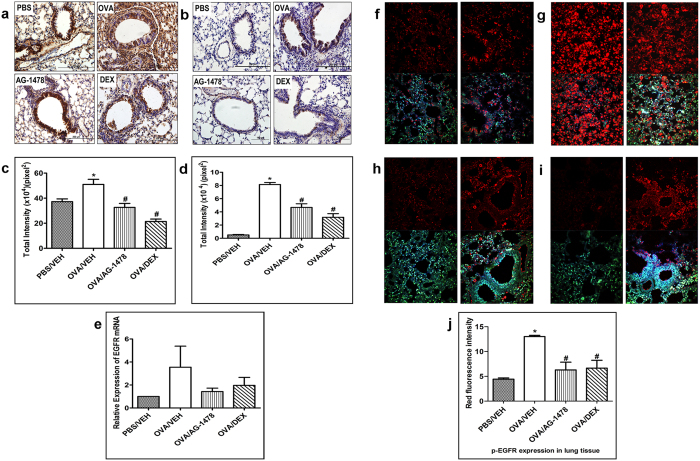
Figure 1.
Effect of AG-1478 on immunohistochemistry, RT PCR and immunofluorescence total EGFR immunohistochemical staining (a) and phosphorylated EGFR immunohistochemical staining (b) distribution photomicrographs of sections of the lung from PBS-challenged and vehicle treated (PBS) (i.p. treated; n = 6), OVA-challenged and vehicle treated (OVA) (i.p. treated; n = 6), OVA-challenged and AG-1478 treated (AG-1478) (0.1 mg/kg; i.p. treated; n = 6), OVA-challenged and dexamethasone treated (DEX) (1 mg/kg; i.p. treated; n = 6) groups. Analysis of the total EGFR (c) and phosphorylated EGFR (d) immunoreactive area in the lung sections of the different treatment groups. Real-time PCR analysis of EGFR expression (n = 4) (e). Data are expressed as mean ± SEM. *P < 0.05 versus time-matched PBS-challenged mice. # P < 0.05 versus time-matched OVA-challenged mice. Immunofluorescent detection of phosphorylated EGFR in lung sections (f–j). Lung sections were taken from different treatment groups [(f)-PBS/Veh; (g)-OVA/Veh, (h)-OVA/AG-1478 (0.1 mg/kg) and (i)-OVA/Dex (1 mg/kg)] and were immunostained against phosphorylated EGFR. Immunofluorescent (Alexa Fluor) signals are shown on the left side of panels are overlaid with DAPI stain on the right side to show tissue architecture for the conditions indicated. Quantitative assessment of fluorescence intensity of phospho EGFR (j) (arbitrary units). Data are expressed as mean ± SEM (n = 3). *P < 0.05 versus time-matched PBS-challenged mice. # P < 0.05 versus time-matched OVA-challenged mice.

