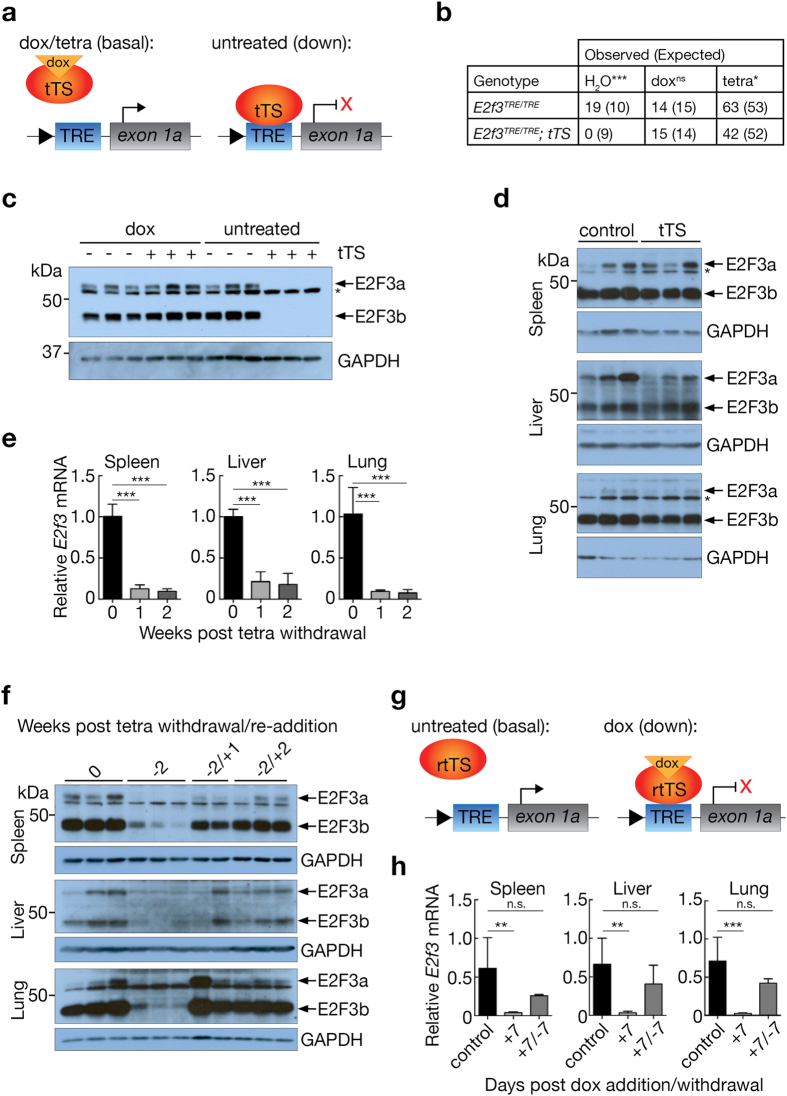
Figure 3.
E2f3 expression may be reversibly repressed in E2f3 TRE/TRE mice. (a) Schematic of tTS(kid)-driven repression. Grey box- exon, blue box- TRE element, red oval- tetracycline regulated repressor, orange triangle- doxycycline. (b) Genotypes of live births from E2f3 TRE/TRE; β-actin-tTS crosses maintained on normal drinking water (H2O), with doxycycline (dox), or with tetracycline (tetra). Chi-square test, ***P < 0.0001 (water), 0.85(dox), 0.04*(tetra). ns = not significant. (c) Immunoblot analysis of E2F3 protein levels in E2f3 TRE/TRE (−) and E2f3 TRE/TRE; β-actin-tTS (+) cultured mouse embryonic fibroblasts, developed and maintained either in the presence (dox) or absence (untreated) of doxycycline. Replicate samples represent independently isolated embryo cultures. GAPDH is included as a loading control. Refer to Supplementary Fig. 12 for full images. (d) Immunoblot analysis of E2F3 protein levels in adult control E2f3 TRE/TRE and E2f3 TRE/TRE; β-actin-tTS tissues isolated from mice maintained on tetracycline. Replicate samples are generated from tissues isolated from independent mice. GAPDH is included as a loading control, *non-specific band. Refer to Supplementary Fig. 13 for full images. (e) Quantitative RT-PCR analysis of E2f3 expression in E2f3 TRE/TRE; β-actin-tTS mice maintained on tetracycline (n = 3) or following 1 (n = 4) or 2 (n = 3) weeks withdrawal of tetracycline. Expression is normalized to HPRT and relative to the mean of the samples maintained on tetracycline. Error bars, s.e.m. One-way ANOVA with a Tukey’s multiple comparisons test, ***P < 0.001. (f) Immunoblot analysis of E2F3 protein levels in E2f3 TRE/TRE; β-actin-tTS mice maintained on tetracycline throughout (0), removed from tetracycline for 2 weeks (−2), or removed from tetracycline for 2 weeks followed by re-addition of tetracycline for 1 week (−2/+1) or 2 weeks (−2/+2). Replicate samples are generated from tissues isolated from independent mice. GAPDH is included as a loading control. Refer to Supplementary Fig. 14 for full images. (g) Schematic of rtTS driven repression. Grey box- exon, blue box- TRE element, red oval- reverse tetracycline trans silencer, orange triangle- doxycycline. (h) Quantitative RT-PCR analysis of E2f3 in control E2f3 TRE/TRE (n = 12 (spleen, liver), 11 (lung)) and E2f3 TRE/TRE; Rosa26 CAGrtTS/+ mouse tissues in the presence of 2 g/L doxycycline for seven days ( + 7, n = 5) or for seven days and a subsequent seven days post withdrawal ( + 7/−7, n = 4). Expression is normalized to HPRT and relative to the mean of the control samples. Error bars, s.e.m. One-way ANOVA with a Tukey’s multiple comparisons test, **P < 0.01, ***P < 0.001, n.s. = not significant.

