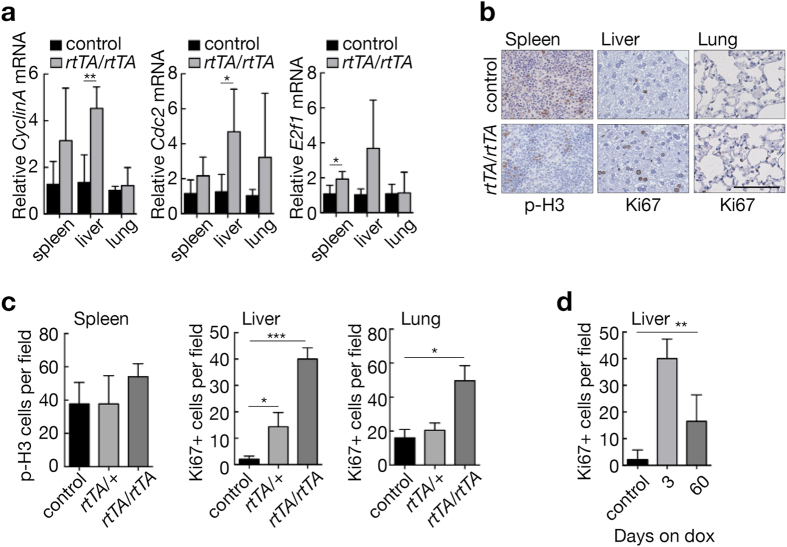
Figure 4.
Consequences of acute E2f3 induction in adult tissues. (a) Quantitative RT-PCR analysis of E2f1, Cdc2 and CyclinA in adult control (n = 5 (spleen, lung), n = 4 (liver)) and E2f3 TRE/TRE; Rosa26 rtTA/rtTA (n = 3) mouse tissues following administration of doxycycline for three days. Expression is normalized to HPRT and relative to the mean of the control samples within each tissue. Error bars, s.e.m. Two-tailed t-test; control vs rtTA/rtTA: **P = 0.01 (CyclinA, liver), 0.05* (Cdc2, liver), 0.05* (E2f1, spleen). (b) Immunohistochemical staining of phosphorylated histone 3 (p-H3) in the spleen and Ki67 in the liver and lung of control and E2f3 TRE/TRE; Rosa26 rtTA/rtTA mice following administration of doxycycline for three days. Scale bar 100 µm. (c) Quantification of p-H3 positive nuclei per field of view of the spleen (red pulp) or Ki67 positive nuclei per field of view in the liver (hepatocytes) and lung isolated from control (n = 5(spleen, lung), n = 9(liver)), E2f3 TRE/TRE; Rosa26 rtTA/+ (n = 3(spleen), n = 4(liver, lung)) and E2f3 TRE/TRE; Rosa26 rtTA/rtTA (n = 4(spleen, lung), n = 3(liver)) mice following administration of doxycycline for three days. Mean of 5 images per mouse; error bars, s.e.m. Mann-Whitney test; control vs. rtTA/+, *P = 0.03 (liver); control vs. rtTA/rtTA, ***P = 0.005 (liver), 0.03* (lung). (d) Quantification of Ki67 positive nuclei per field of view in liver (hepatocytes) isolated from control (n = 9) and E2f3 TRE/TRE; Rosa26 rtTA/rtTA mice after 3 (n = 3) or 60 (n = 5) days continuous doxycycline administration. Mean of 5 images per mouse; error bars, s.e.m. Control and rtTA/rtTA quantifications from panel C are included for comparison. Mann-Whitney test; control vs. 60days, **P = 0.005. Controls for (a–d) include E2f3TRE/TRE on and off doxycycline and E2f3 TRE/TRE; Rosa26 rtTA/+ and E2f3 TRE/TRE; Rosa26 rtTA/rtTA maintained in the absence of doxycycline.

