Figure 3.
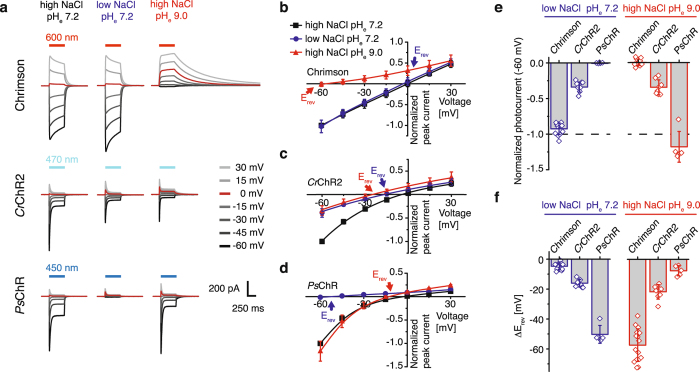
Comparison of Chrimson with other ChRs. (a) Representative photocurrents of Chrimson, CrChR2 and PsChR at different voltages and symmetric solution of 110 mM NaCl and pHe 7.2 (left), after reduction of extracellular sodium (1 mM NaCl and pHe 7.2, middle) and proton concentration (110 mM NaCl, pHe 9.0 right) (b) The current-voltage dependence of normalized peak photocurrents of Chrimson under the ionic conditions described in (a) (mean ± SD; black: symmetric 110 mM NaCl and pHi/e 7.2, n = 37 cells; blue: 1 mM NaCl and pHe 7.2, n = 14 cells; red: 110 mM NaCl and pHe 9.0, n = 16 cells). (c) Normalized peak photocurrents of CrChR2 plotted against the applied membrane voltage (mean ± SD; n = 8–12 cells). (d) Normalized peak photocurrents of PsChR plotted against the applied membrane voltage (mean ± SD; n = 5 cells). (e) Photocurrent amplitudes at −60 mV normalized to symmetric standard conditions of 110 mM NaCl pHe 7.2 (dashed line) corresponding to (a), (Mean ± SD; LJP corrected; blue: 1 mM NaCl and pHe 7.2; red: 110 mM NaCl and pHe 9.0; intracellular solution: 110 mM NaCl and pHi 7.2; Chrimson n = 14–16, CrChR2 n = 8–9, PsChR n = 5) (f) Corresponding reversal potential shifts upon extracellular buffer exchange from symmetric 110 mM NaCl and pHe 7.2 to low extracellular sodium (left, blue, 1 mM NaCl and pHe 7.2) or low extracellular proton (right, red, 110 mM NaCl and pHe 9.0) concentration (mean ± SD; LJP corrected; Chrimson n = 14–16, CrChR2 n = 8-9, PsChR n = 5).

