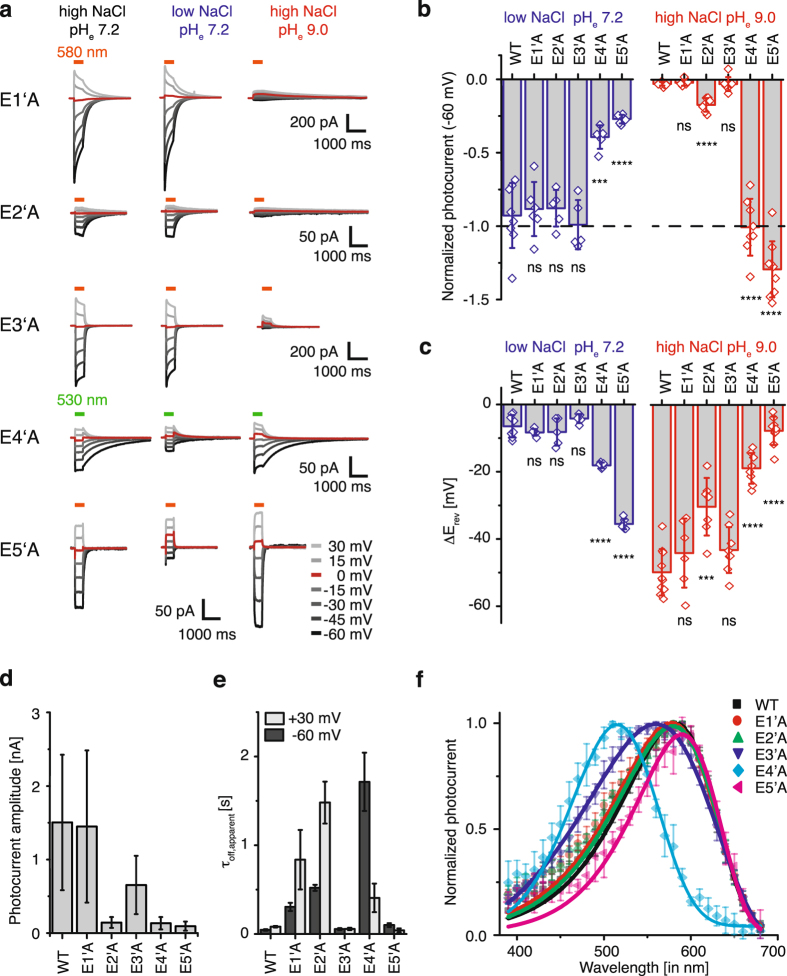
Figure 5.
Chrimson glutamate mutants along the ion-conducting pathway. (a) Representative photocurrents of Chrimson glutamate mutants at different voltages and different extracellular solutions of 110 mM NaCl and pHe 7.2 (left), 1 mM NaCl and pHe 7.2 (middle) and 110 mM NaCl and pHe 9.0 (right) with intracellular 110 mM NaCl pHi 7.2. (b) Corresponding photocurrent amplitudes at −60 mV normalized to symmetric standard conditions of 110 mM NaCl pHe 7.2 (dashed line) (Mean ± SD; LJP corrected; blue: 1 mM NaCl and pHe 7.2; red: 110 mM NaCl and pHe 9.0; compared to WT by a two sample t-test for “low NaCl pHe 7.2”/“high NaCl pHe 9.0” conditions respectively; WT: n = 8/10 cells; E1’A: n = 6/6, p = 0.7/0.4; E2’A: n = 5/7 p = 0.6/0.0002; E3’A: n = 5/8,p = 0.6/0.9; E4’A: n = 5/8, p = 0.0002/< 0.0001; E5’A: n = 6/9, p < 0.0001/0.0001) (c) Related reversal potential shifts upon extracellular buffer exchange from symmetric 110 mM NaCl and pHe 7.2 to low extracellular sodium (left, blue, 1 mM NaCl and pHe 7.2) or low extracellular proton (right, red, 110 mM NaCl and pHe 9.0) concentration (mean ± SD; LJP corrected; compared to WT by a two sample t-test for “low NaCl pHe 7.2”/“high NaCl pHe 9.0” respectively; WT: n = 8/10 cells; E1’A: n = 6/6, p = 0.2/0.3; E2’A: n = 5/7 p = 0.45/0.0004; E3’A: n = 5/8, p = 0.11/0.06; E4’A: n = 5/8, p < 0.0001/0.0001; E5’A: n = 6/9, p < 0.0001/0.0001). (d) Photocurrent amplitudes at −60 mV in symmetric 110 mM NaCl and pHi,e 7.2 (mean ± SD; WT n = 16 cells; E1’A n = 9; E2’A n = 10; E3’A n = 14; E4’A n = 11; and E5’A n = 10). (e) Apparent off-kinetics (τoff,apparent) at pHe/i 7.2 and −60 mV or +30 mV (mean ± SD; WT n = 18 cells; E1’A n = 9; E2’A n = 8; E3’A n = 14; E4’A n = 9 cells; E5’A n = 9). (f) Normalized peak photocurrents after 10 ms excitation at different wavelengths of equal photon count (mean ± SD; symmetric 110 mM NaCl, pHe,i 7.2 and −60 mV; WT n = 10 cells; E1’A n = 7; E2’A n = 5; E3’A = 8; E4’A n = 6; E5’A n = 5).

