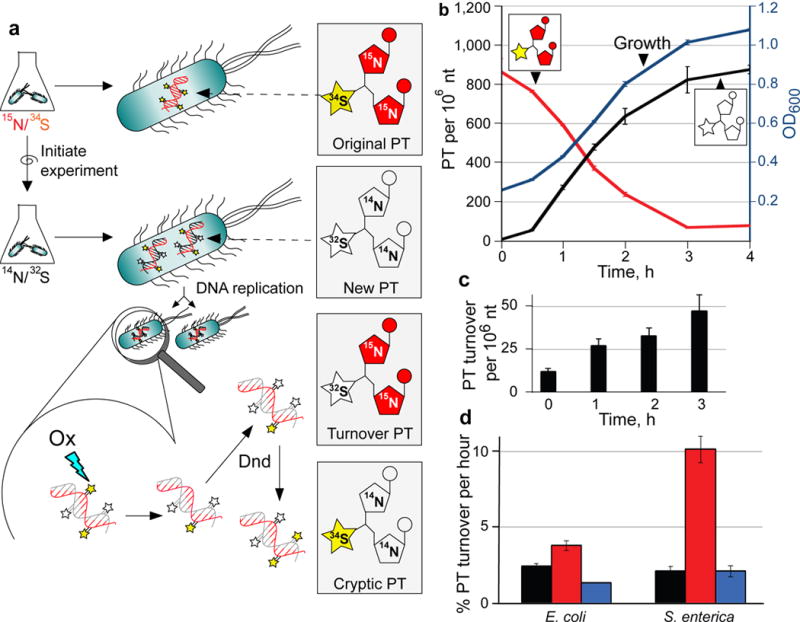
Figure 5. Quantification of PT turnover by isotope-labeling and mass spectrometry.

(a) Principle of PT turnover assay. Bacteria were grown in minimal medium containing [15N]/[34S]-labeled nutrients, with resulting bacterial DNA containing [15N]-labeled nucleobases with [34S]-labeled PTs (Original PT). To initiate an experiment, cells are transferred to minimal medium with [14N]/[32S]-labeled constituents and subjected to stresses. Newly synthesized PT-linked dinucleotides (New PT) are labeled with [14N] and [32S]. The [34S] in the original PTs was found to undergo replacement with [32S] (Turnover PT) in both untreated and oxidant-treated cells. We also observed low levels of PT dinucleotides labeled with [34S] and [14N] (Cryptic PT) resulting from reuse of [34S] from nutrient pools or other PT modification sites. In all cases, isolated DNA was hydrolyzed to canonical mononucleotides and PT-containing dinucleotides, and quantities of various isotope-labeled dinucleotides were determined by LC-MS/MS analysis. (b) Validation of PT turnover method. Cultures of wild-type E. coli B7A were grown with [15N]/[34S]-containing medium, and then cells were transferred to [14N]/[32S]-containing medium. At various times, genomic DNA was isolated and subjected to LC-MS/MS analysis of PT-containing dinucleotides. The plot shows cell growth (OD600; blue line), original PT (red line) and new PT (black line). (c) The level of [15N]/[33S]-labeled, PT-containing dinucleotides (“turnover” PT) were determined in wild-type, untreated E. coli B7A as a function of time. The level of this turnover PT as a function of total PT was used to calculate the %PT turnover. (d) Estimates of the rate of PT turnover per hour were calculated by performing linear regression analysis of plots of %PT turnover as a function of time in unstressed E. coli B7A and S. enterica Cerro 87 (black) and for bacteria exposed to HOCl (red) and H2O2 (blue), with regression analysis illustrated in Supplementary Figure 7 for wild-type, untreated Cerro 87. Data represent mean ± SD for 3 biological replicates and values for HOCl-treated samples are significantly different from untreated and H2)2-treated by Student’s t-test at P < 0.05.
