
Figure 1. Discovery of small molecule inhibitors targeting N-Acetyl-UBE2M interaction with DCN1.
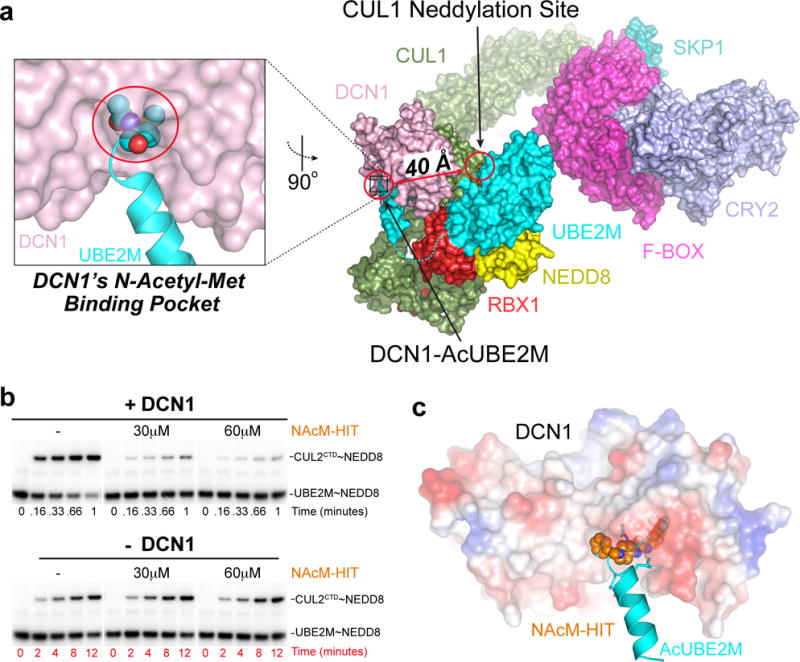
(a) Model of a neddylation complex, highlighting DCN1 (pink) interactions with acetylated N-terminus of UBE2M (cyan), including structures of CUL1 (green)-RBX1 (red) and SKP1 (pale cyan)-FBXL3 (magenta)-Substrate (CRY2, light blue)20. Although ≈40 Å from the CUL1 neddylation site, the DCN1-AcUBE2M interaction accelerates neddylation20.
(b) Pulse-chase assays monitoring effects of the indicated concentrations of NAcM-HIT on DCN1-dependent (top, timescale 0–1 min) or DCN1-independent (bottom, timescale 0–12 min) neddylation from AcUBE2M to CUL2CTD. The gel scans are representative of multiple biological replicates.
(c) Structure of DCN1 (surface colored by electrostatic potential) bound to NAcM-HIT (spheres, orange) aligned to DCN1 (omitted for clarity)-AcUBE2M (cyan) demonstrating NAcM-HIT binds to DCN1’s N-AcetylMet binding pocket.