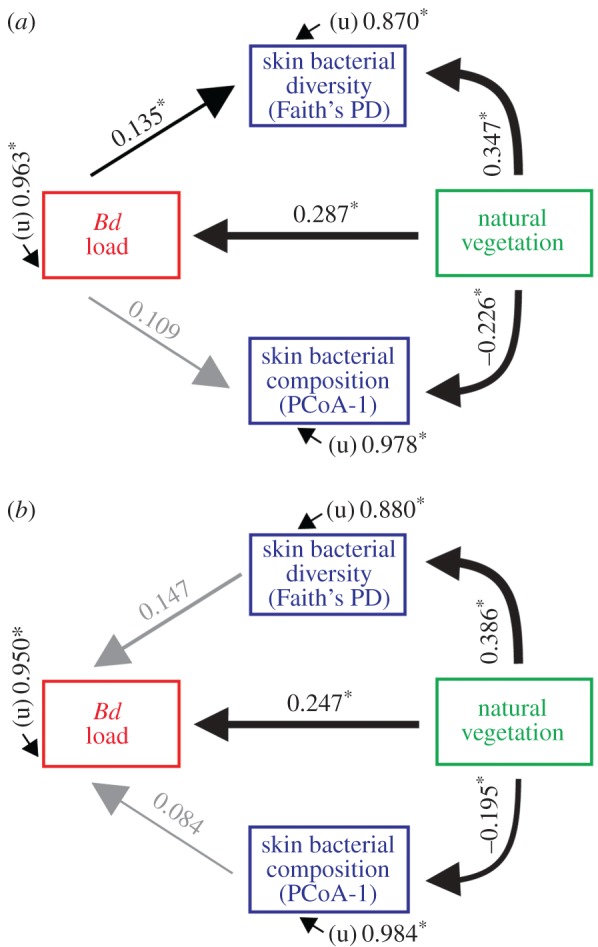
Figure 4.

Path analyses showing direct and indirect effects of natural vegetation on both amphibian skin microbiome and Bd. Model (a) shows the relative strengths of natural vegetation (%) on skin bacterial diversity (Faith's phylogenetic diversity), skin bacterial composition (PCoA axis I; unweighted UniFrac distances), and Bd loads (log–G.E.), including the effect of Bd loads on both skin bacterial diversity and composition. Model (b) includes the effects of skin bacterial diversity and composition on Bd loads. Numbers are standardized path coefficients (*p < 0.05). Latent (unmeasured) variables represented by ‘u’. The thickness of the arrows represents the relative strength of each relationship. Direct effect probabilities: effect of skin bacterial diversity on Bd loads (p = 0.041); Bd loads on skin bacterial diversity (p = 0.062). Non-significant paths are shown in grey. (Online version in colour.)
