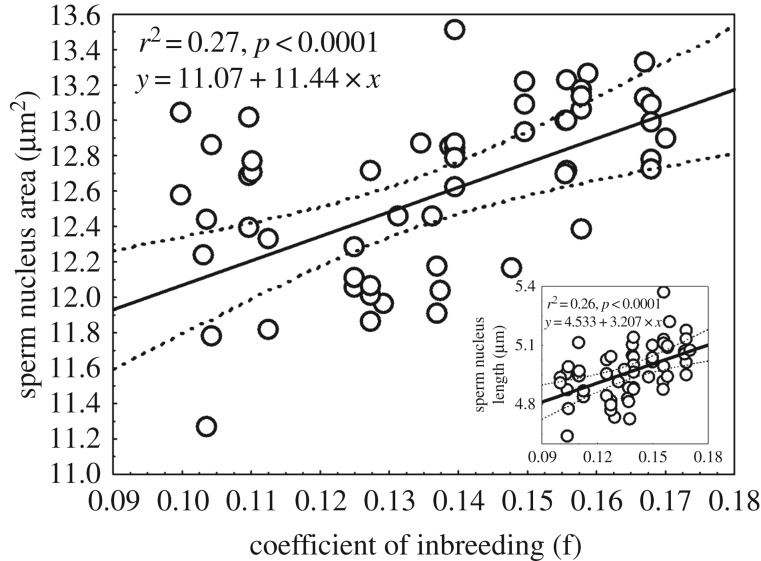
Figure 3.
Relationship between the father's coefficient of inbreeding (f) and the sperm nucleus area (or nucleus length; inlet graph). Each data point reflects the mean calculated using a minimum of 200 sperm per male. Two outlier data points for sperm nucleus area were removed (2.85 s.d. and 3.12 s.d. away from the mean sperm nucleus area). n = 58.

