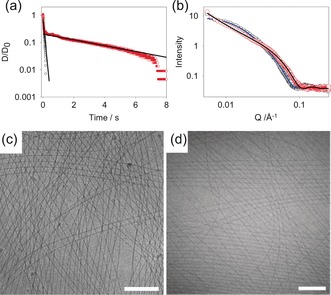
Figure 2.

a) Diameter–time data from CaBER experiments, including exponential fits to obtain estimates of relaxation time (λ). Key: a freshly prepared solution (10 mg mL−1; pH 11; (○)), a sample after heating and cooling (○), exponential fits (—). b) SAXS data (intensity vs. scattering vector (Q)) for a solution of 2NapFF (10 mg mL−1; pH 11) before heating ((○); fit (—)) and after heating and cooling ((○); fit (—)). c,d) Cryo‐TEM of a solution of 2NapFF before heating (c) and after a heat/cool cycle (d); scale bar=200 nm.
